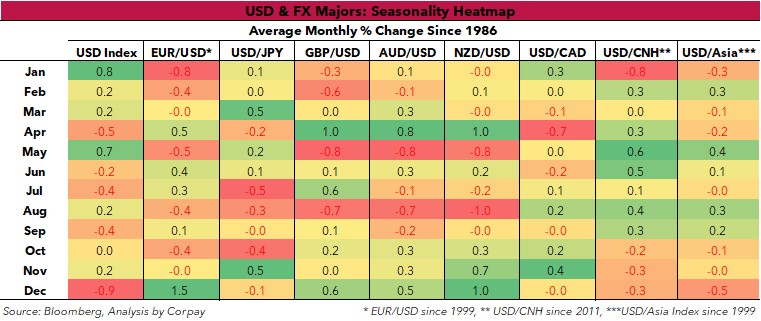
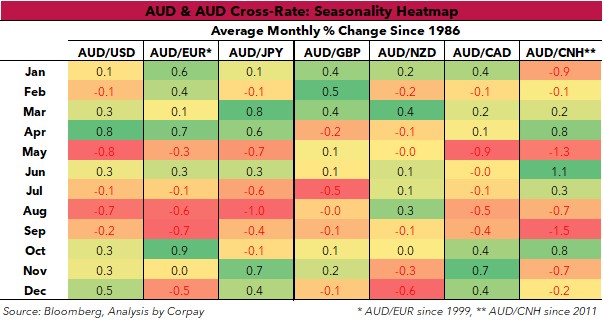
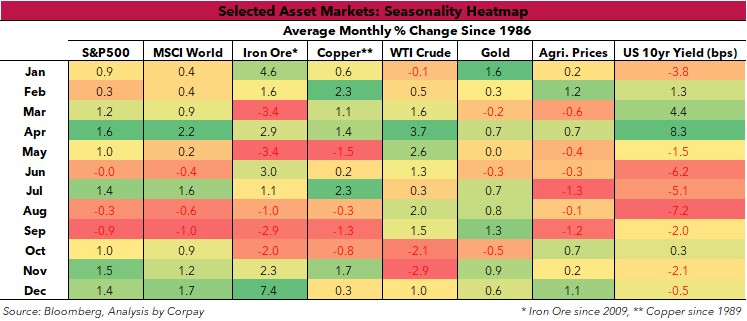
“History Doesn’t Repeat Itself, But It Often Rhymes”. Based on our analysis of seasonal performance this statement seems to hold true for several currencies and other important financial markets. For the aficionados although we found no ‘stable statistical seasonality’, there seems to be a lot of ‘coincidence’ as a variety of things such as production and trade trends, financial year end related flows, asset allocation changes, and/or thinner liquidity conditions during the Northern Hemisphere summer or Christmas period compound or counteract unfolding macroeconomic developments.
Our Seasonality Heatmaps, provided at the bottom of this note, illustrate the average monthly performance of the major currencies, the AUD and key AUD cross-rates, and a selection of other asset markets over the past few decades. As discussed below, this isn’t foolproof, and the economic and market circumstances of the day should continue to be considered, but we believe there are clearly some tendencies people should be aware of. We think our seasonality trackers are useful additions for clients (especially the more active or opportunistically minded ones) to have in their toolkit as another reference point in their FX hedging decision-making process.
A closer look at the trends
In terms of key findings:
The USD Index tends to start the calendar year on the front-foot, with gains typically occurring over Q1. May is another positive month for the USD, as are August and November (though to a less extent), with April, September, and December months when the USD Index has historically lost ground.
The AUD and major AUD crosses exhibit some interesting patterns. AUD/USD often depreciates in May and August, while April and Q4 are more positive periods. On the crosses, what catches the eye is the broad AUD underperformance in May and August-September, and then again against the EUR, NZD, and CNH at the end of the year. By contrast, the AUD is relatively stronger against the EUR and GBP over January-February, versus NZD in March and July, vis-à-vis the CNH over June-July, versus CAD in January, and Q4, and against the JPY in April, June, and Q4.
FX is a relative price. The AUD’s performance, especially on the crosses, in part stems from developments on the other side of the ledger, such as timing of EUR trade flows, the NZD impact from NZ seasonal dairy production etc. (see below). But more AUD-centric influences also play a part. Notably, Australia’s non-seasonally adjusted trade balance (which provides a better sense of real world/FX flows) is, on average, an AUD-supportive surplus through late Q1 and December, and a more AUD-negative smaller surplus or deficit over Q3.
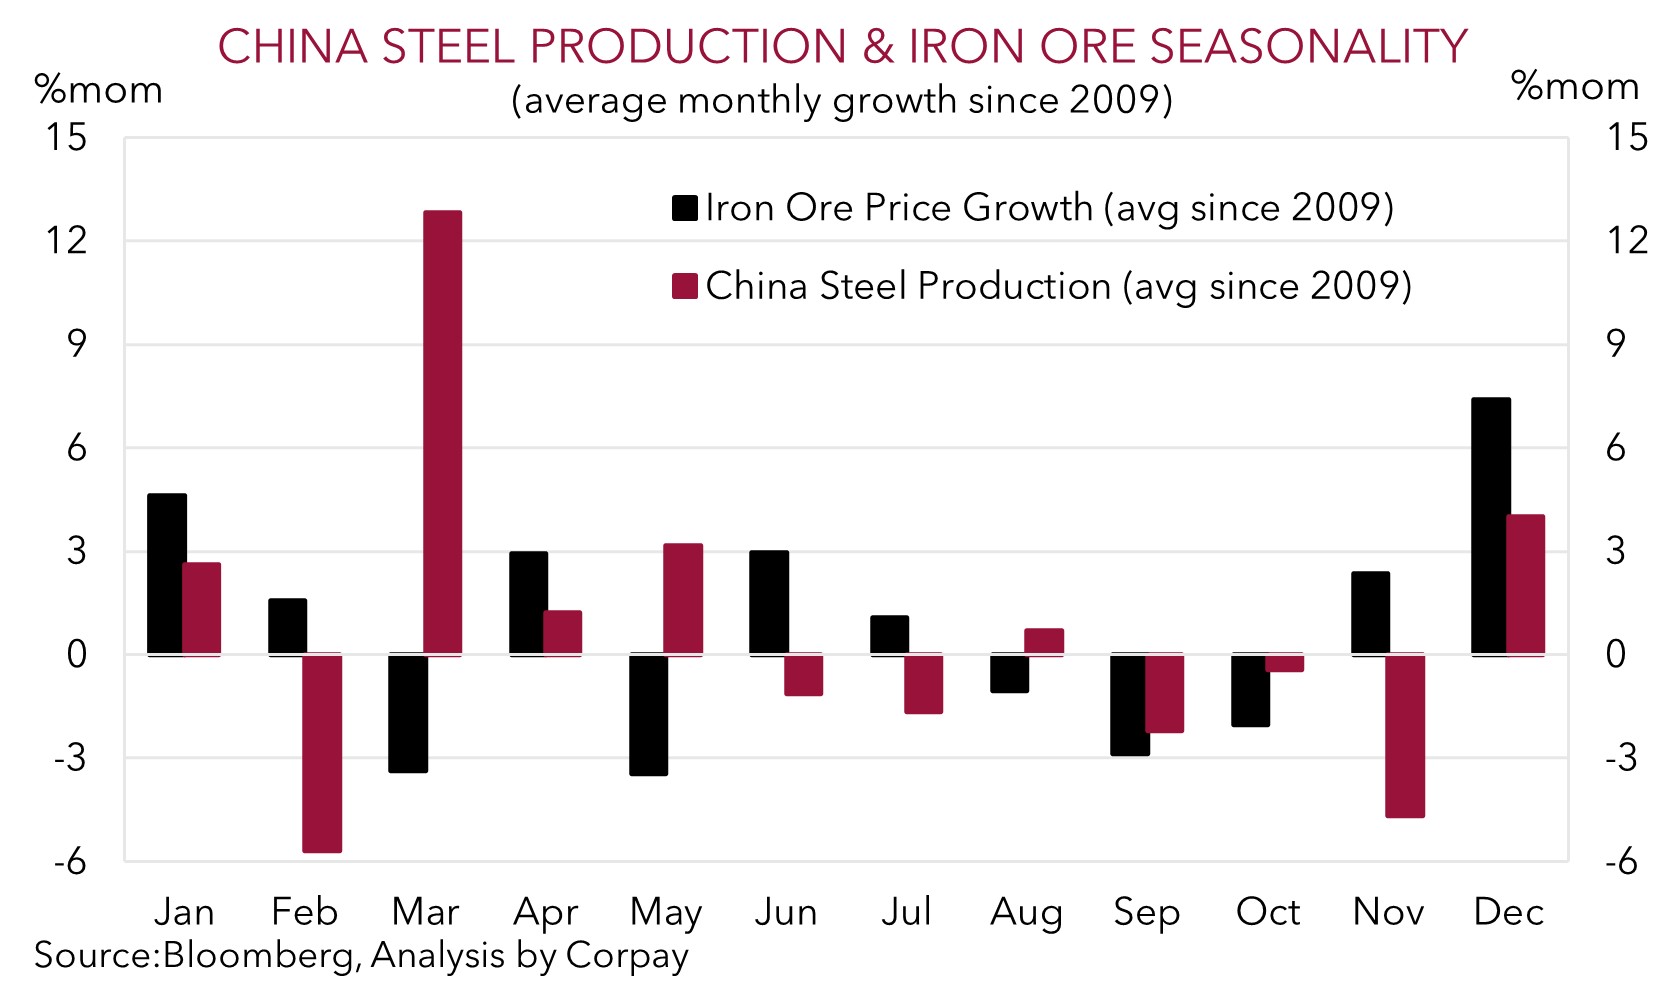
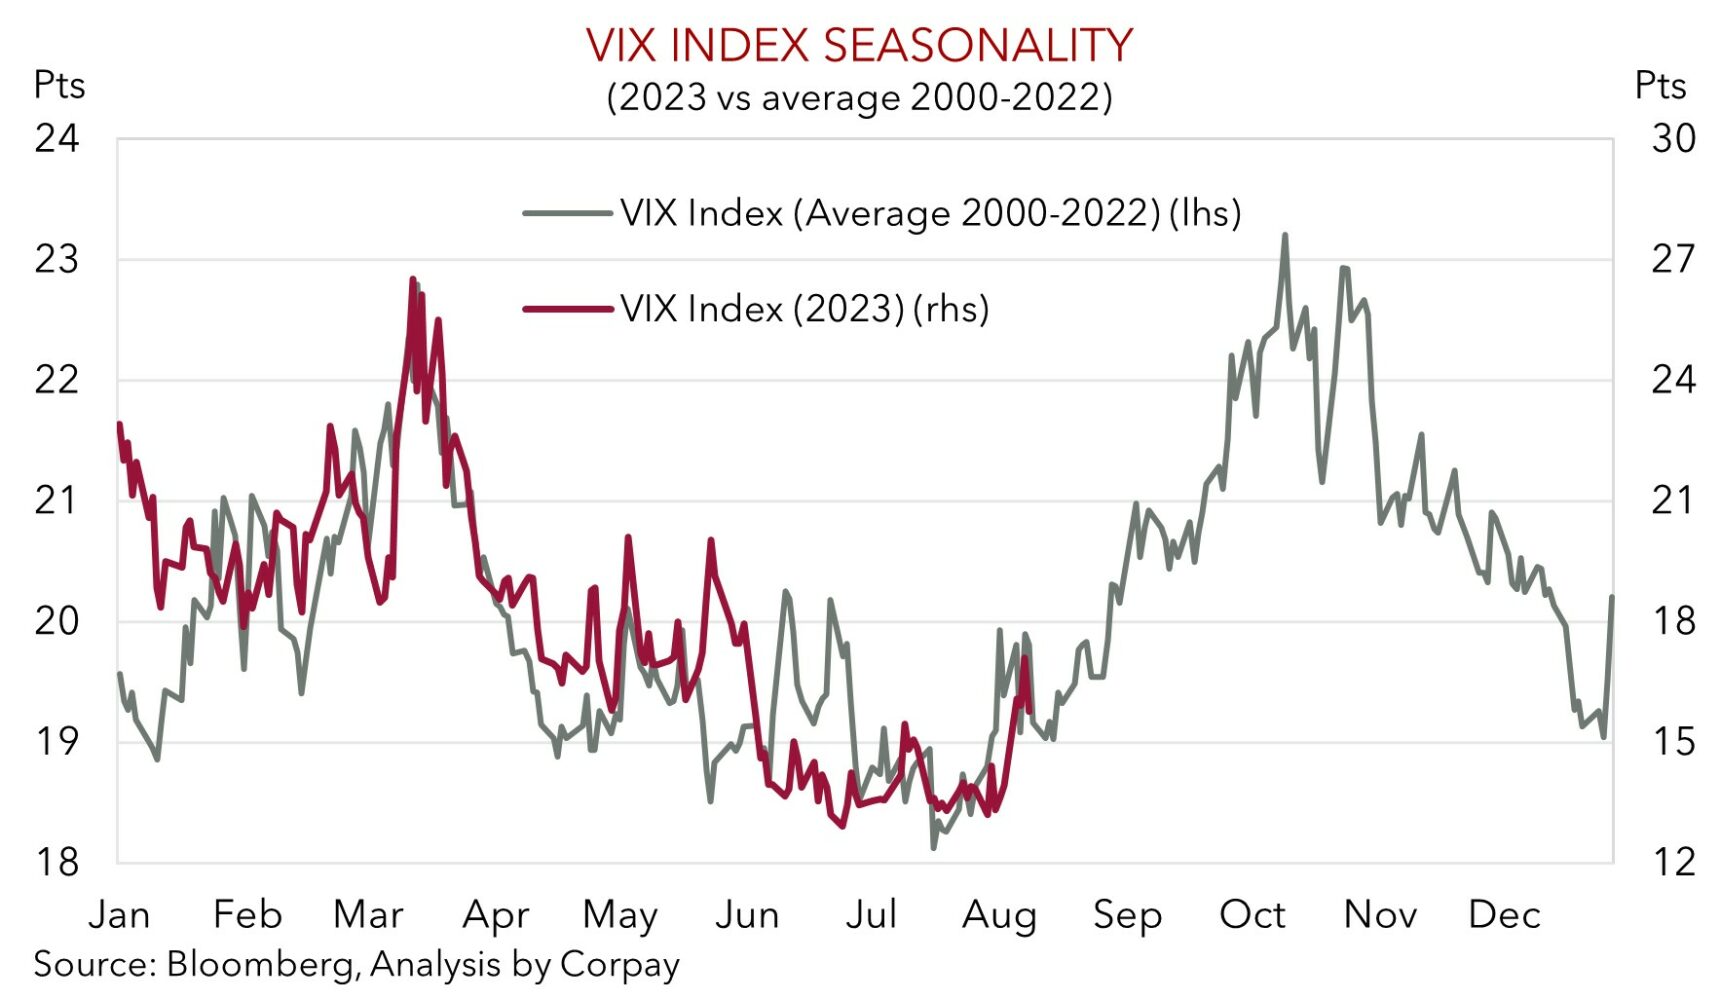
Similarly, seasonally type swings in Chinese steel production, iron ore/base metal demand, CNH/Asian currencies, and risk sentiment, often coincide with AUD gyrations. As shown, Chinese steel production typically tapers off over Q2/Q3, while iron ore prices usually weaken over May as well as during August-October as more Chinese domestic supply comes on stream during the warmer Northern Hemisphere months. Added to that risk assets have repeatedly experienced bouts of volatility between August-November with several flare-ups occurring as macro/geopolitical risks bubble to the surface and/or as Northern Hemisphere participants reassess the outlook post their summer break. By contrast, a year-end rally in risk assets and lower volatility (when it occurs) has been AUD positive.
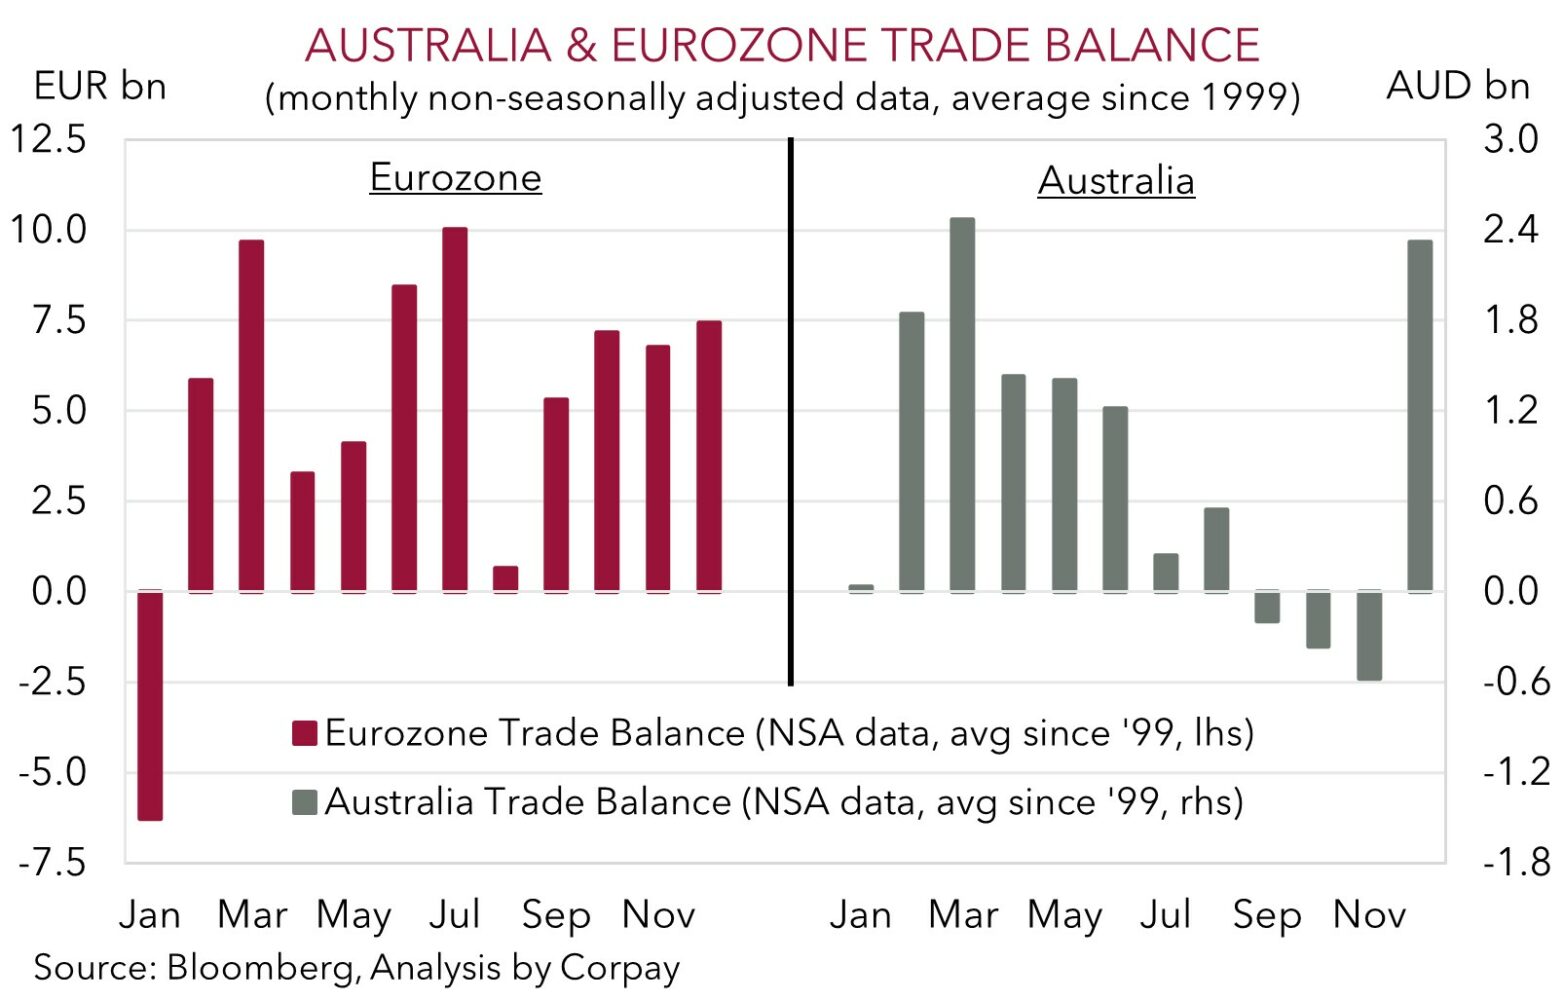
The USD trends flagged reflect moves in other major currencies. EUR (the main USD alternative) is often weaker over January-February, May, and August, and it has more often appreciated in June and December. In our view, this could stem from most Eurozone nations operating under a January-December financial year, and/or the reduced industrial activity during the European summer period. Indeed, when looking at the Eurozone’s trade balance on a non-seasonally adjusted basis is it noticeable that, on average, the region runs a substantial deficit (i.e. January) or smaller surpluses (i.e. May and August) in the months when the EUR has underperformed, and larger surpluses in the months when the EUR has strengthened.
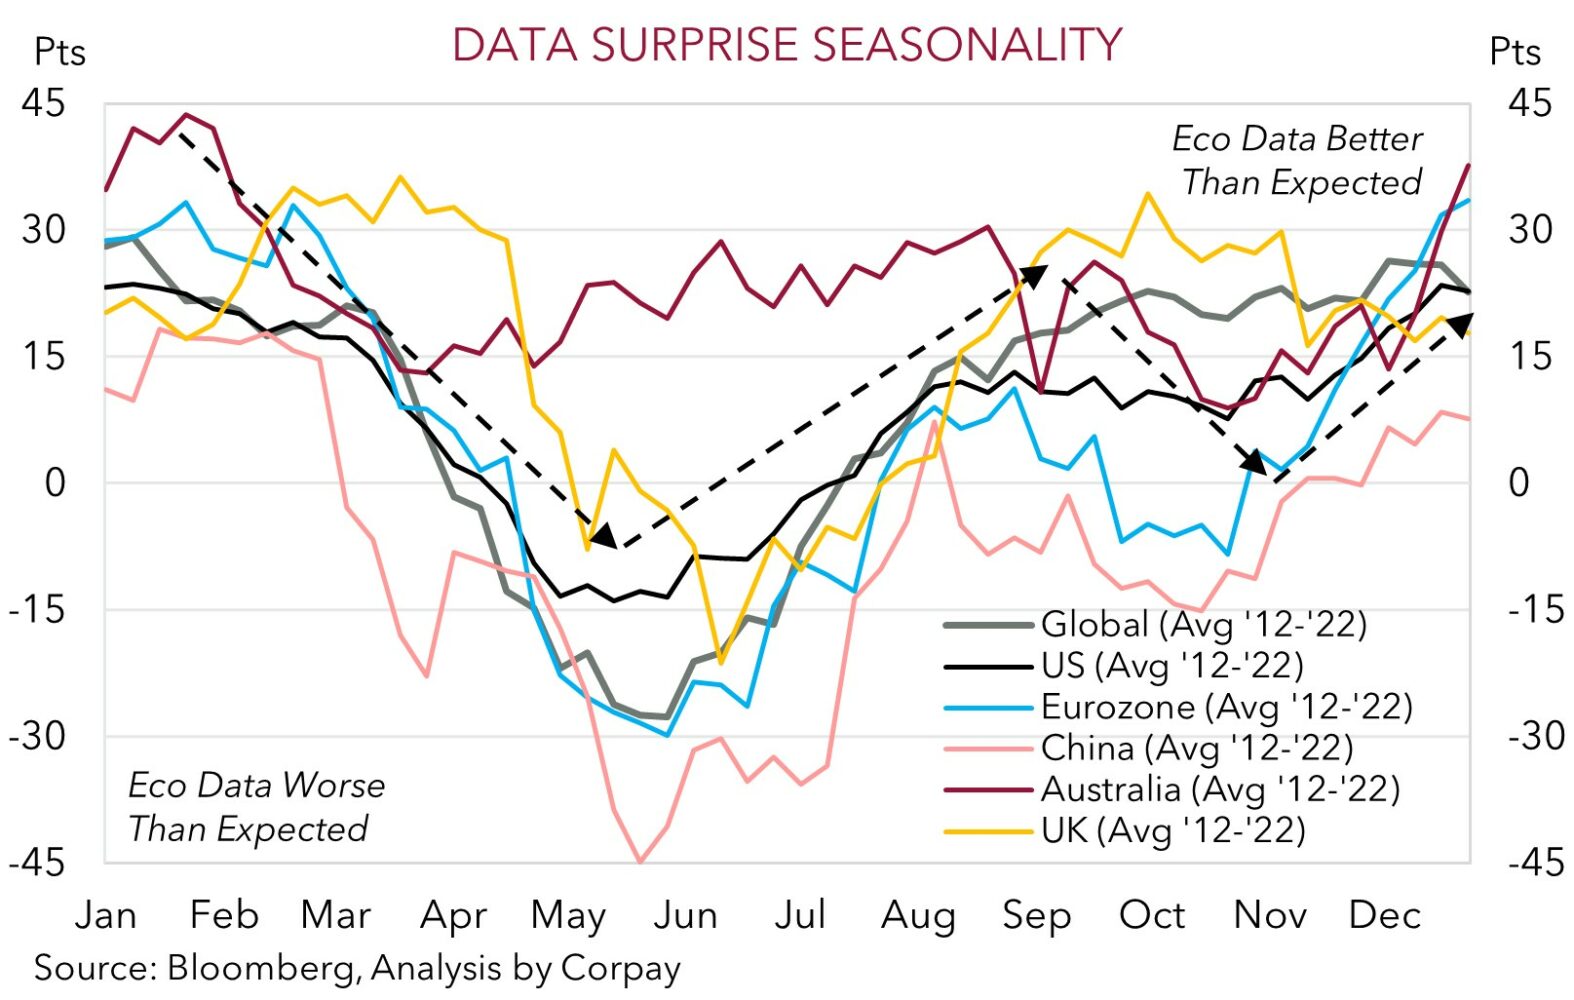
Much like the EUR, GBP has often been softer in January-February, though its highest negative bias is in May followed by August. By contrast, GBP has been inclined to appreciate in April, June, and December. Capital flows around the start of the new UK financial year (which kicks off on 6 April) and the more positive risk backdrop towards year-end are likely to be factors at play. Similarly, USD/JPY has also had fewer negative months over Q4, and between May-June, with more upbeat sentiment weighing on the JPY. The JPY has strengthened most often over July-September, a reflection of the seasonally higher market volatility and repeated episodes of the global economic data underwhelming consensus predictions over the middle of the year.
CNH and the broader Asian FX basket have, on average, risen against the USD between October and January. A weaker USD leading into year-end (see above), combined with (normally) firmer equity and commodity prices, and supportive flows in the lead up to Lunar New Year appear to underpin CNH and other Asian currencies over this period. By contrast, USD/CNH has regularly been under upward pressures between April and June, and over August-September.
For the NZD, May, and August standout from a negative bias perspective, with April and December the most positive months. Weaker dairy exports (which accounts for ~5% of NZ GDP) given lower seasonal production over July and August (combined with repeated wobbles in risk sentiment at this time of year) help explain the NZD’s August underperformance. The rebound in dairy production, (usually) higher agricultural commodity prices and stronger equity markets, and USD weakness has generally given the NZD a shot in the arm (and pushed down AUD/NZD) in Q4.
Is 2023 repeating?
Although some of the factors appear a bit different, such as the RBA’s decision to hold rates steady at the 1 August meeting, as outlined, the AUD’s weakness (so far) during August 2023 is not out of the norm. The recent market turbulence and USD revival is broadly in line with the pattern for this time of the year. And in our judgement the AUD’s rough ride may extend. We believe this tricker macro/market environment could endure for a while longer as the negative economic effects from the very abrupt tightening in global monetary policy continue to crystalise and/or inflation lingers for longer than optimistic markets now envisage.
However, after a few more tricky months where we expect the AUD to continue to be pushed and pulled by the support afforded from Australia’s current account surplus (~1.4% of GDP) and the high level of the terms-of-trade, and the headwinds created by the step down in global growth, we continue to forecast the AUD to grind back up into the low 0.70’s by early-2024. As the worst of the global downturn passes, and major central banks like US Fed definitively move away from their ‘inflation fighting’ stance we are looking for the ‘overvalued’ USD to weaken. On top of that, we think developments in China should also be AUD supportive over the medium-term. We are looking for more stimulus measures aimed at reinvigorating China’s faltering economy to be unveiled over coming months. The expected CNH-supportive capital inflows and improved regional growth prospects should, in our opinion, help drag the AUD higher given the tight correlation between the pairs. If realised, this would once again show that while history doesn’t repeat, it often rhymes.
