With 2023 firmly in the rear-view mirror and markets starting 2024 with a bout of central banker driven upheaval as enthusiastic interest rate cut expectations are pared back, we thought it is an opportune time to spell out our AUD thoughts. And refresh people’s minds about some of the AUD’s historic tendencies which we believe should be kept in mind when managing FX exposures, especially considering the tricky terrain markets and economies will be navigating over coming months.
Regular readers of our research would be aware that after an anticipated bout of turbulence over Q3/early-Q4 2023 we were vocal regarding the prospect the AUD should snap back into year-end (see Market Musings: AUD: Always darkest before the dawn and Market Musings: USD losing its shine). That said, the extent of the AUD’s rally was a surprise, a function of overzealous technical trend following with the moves overshooting the change in fundamental drivers. Hence, the USD inspired pull-back so far over January, with the AUD now ~4.6% below its December peak and tracking sub $0.66 (near a ~6-week low), isn’t that much of a shock.
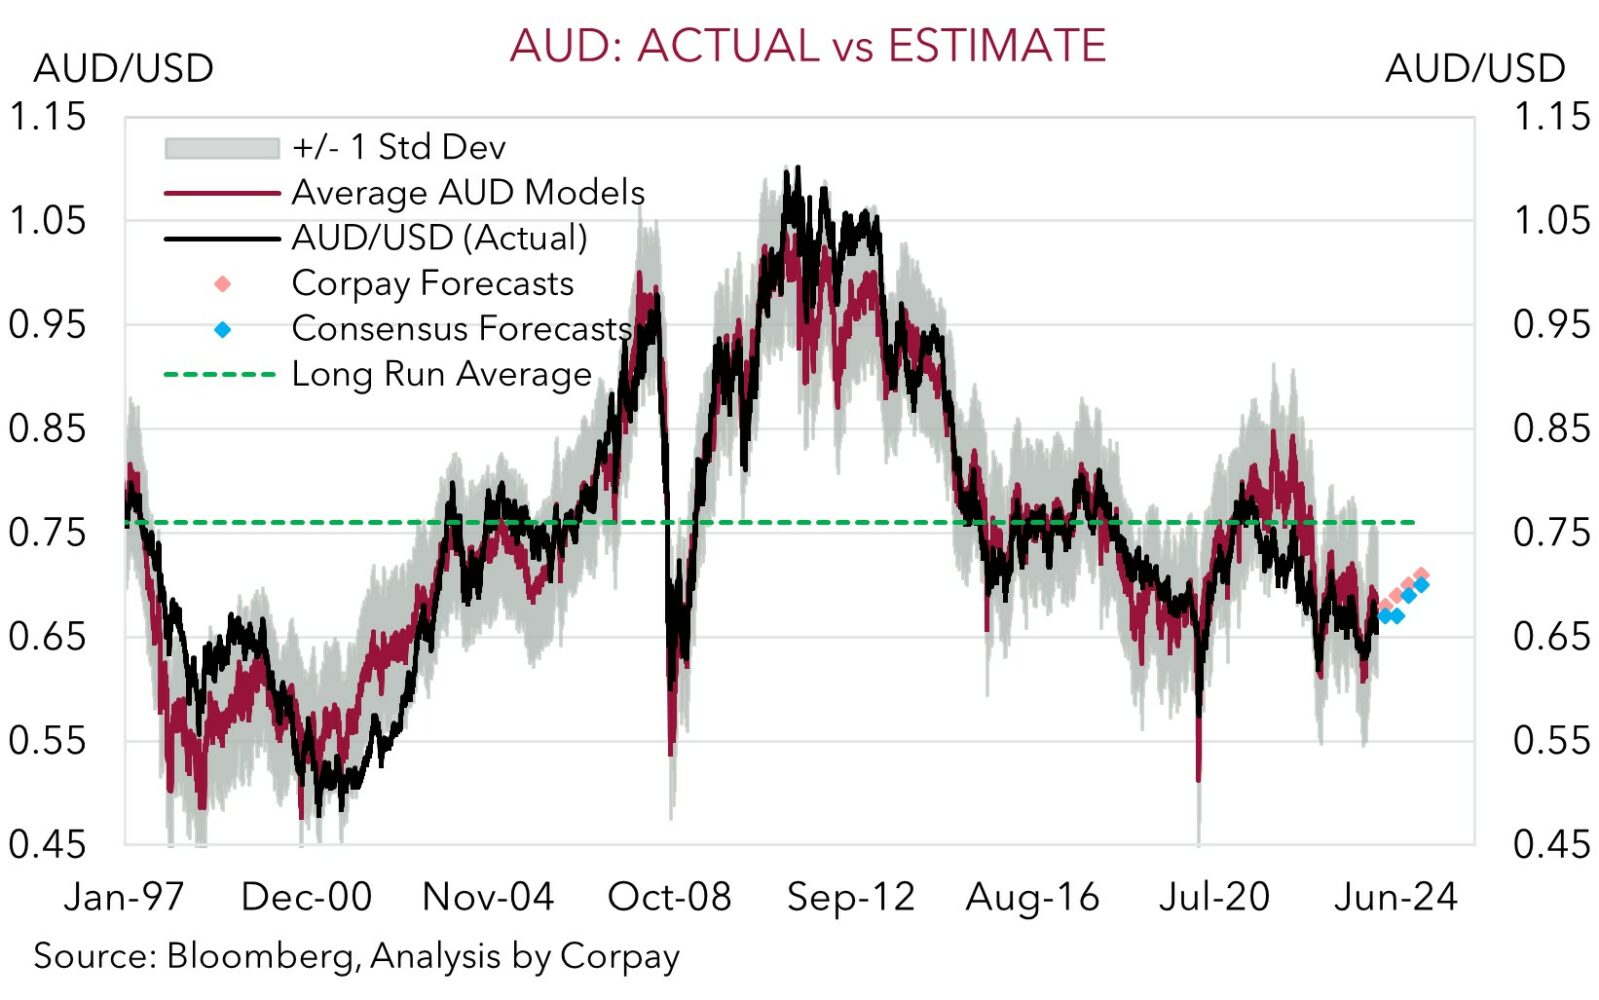
Our long-held baseline view (which consensus forecasts have steadily converged towards the past year) is for the AUD to average a slightly higher level over 2024 compared to last year (i.e. ~$0.69 vs $0.66 in 2023) (Chart 1). Although within that it looks set to be a tale of two halves. The AUD is seen meandering around ~$0.67 (on average) over H1 as various cross-currents wax and wane before kicking on into the low ~$0.70s late in the year as:
(a) The USD gradually loses ground as the US’s economic outperformance fades, the labour market loosens, and inflation slows, opening the door for the US Fed to begin a rate cutting cycle from mid-year (see Market Musings: US Fed pivot has further to run);
(b) Activity in China improves, particularly across the commodity-intensive sectors, as stimulus gains traction and this spills over into the Eurozone, Asia, broader Emerging Markets, and Australia which are leveraged to its economic fortunes; and
(c) Support to demand from the expanding population, incoming Stage 3 tax cuts, tightish labour market conditions, and stickiness across ‘services’ inflation sees the RBA lag its peers in terms of when it starts and how far it goes during the next easing cycle. If realised this should see yield differentials shift in favour of a higher AUD.
However, as described, central outlooks such as our own, are predicated on working assumptions. And we would note that there are notable risks around how important parts of the story might pan out. This is typical for this point in the economic cycle given visibility of how things are travelling often becomes murkier at turning points. We see two-way risks around:
(a) China. Will authorities over deliver on the stimulus front causing the economy to exceed predictions, or will the drag from the property downturn continue causing the growth slowdown to fan deflation fears?;
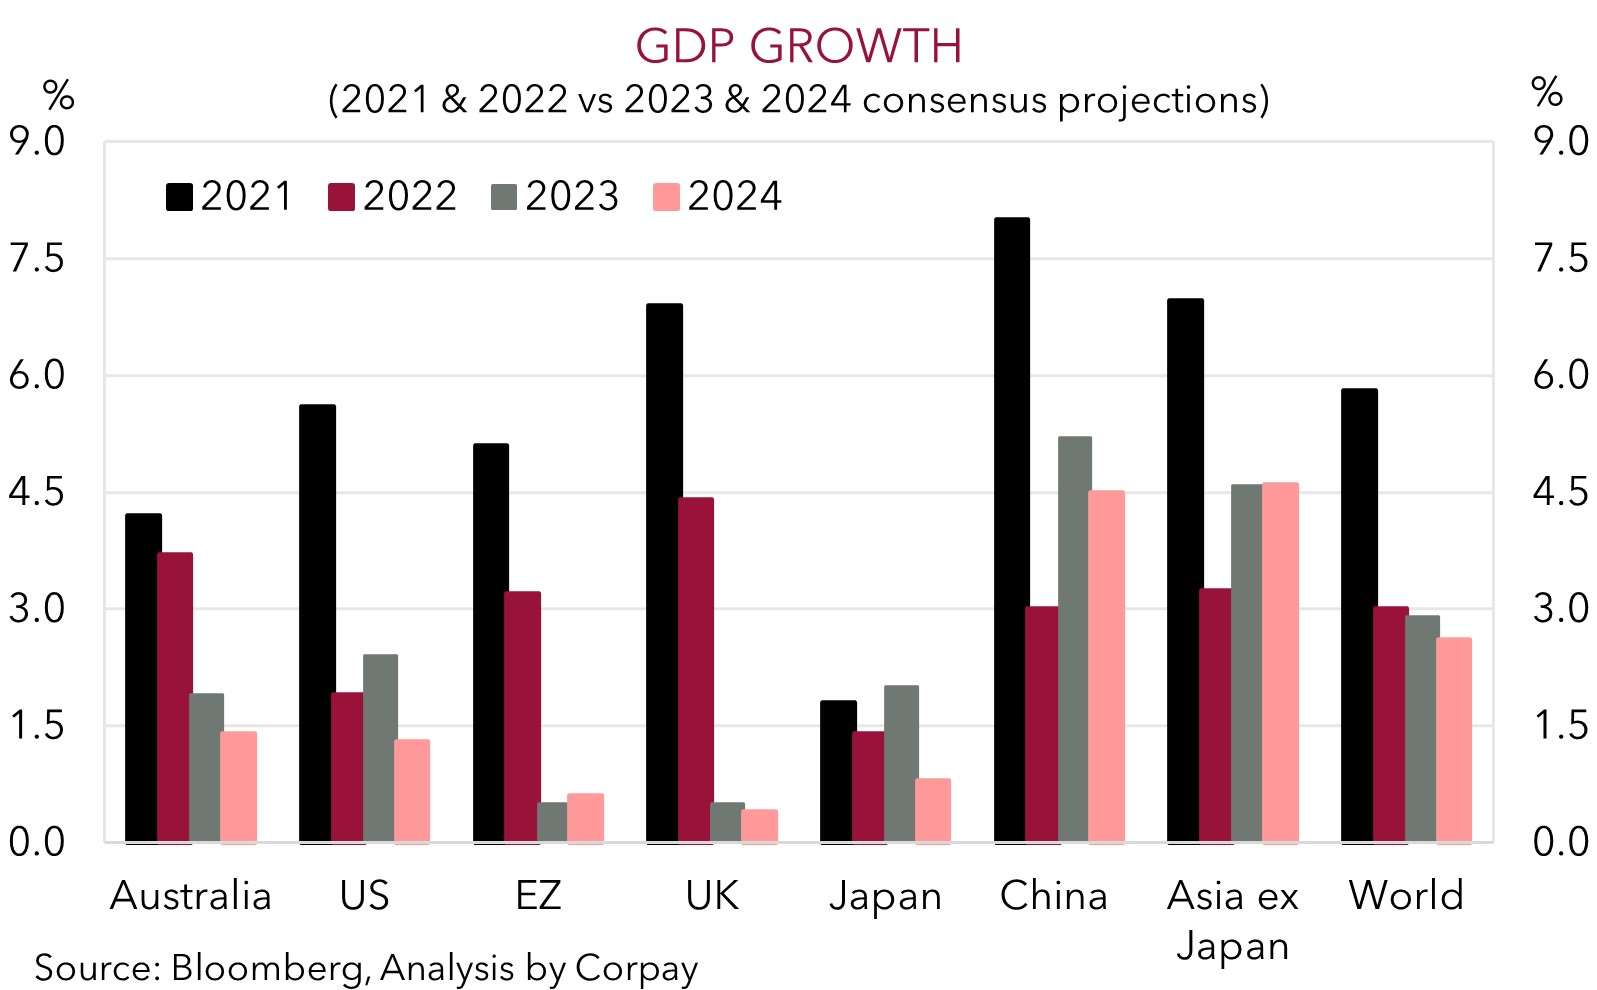
(b) Economic momentum. Will seemingly baked in ‘soft landing’ views looking for growth across major economies to slow and inflation to decelerate without morphing into something more sinister crystalise, or will the ‘long and variable’ lags associated with monetary policy changes manifest forcefully as inflection points are reached and amplifiers like high debt and rising unemployment kick in? (Chart 2); and
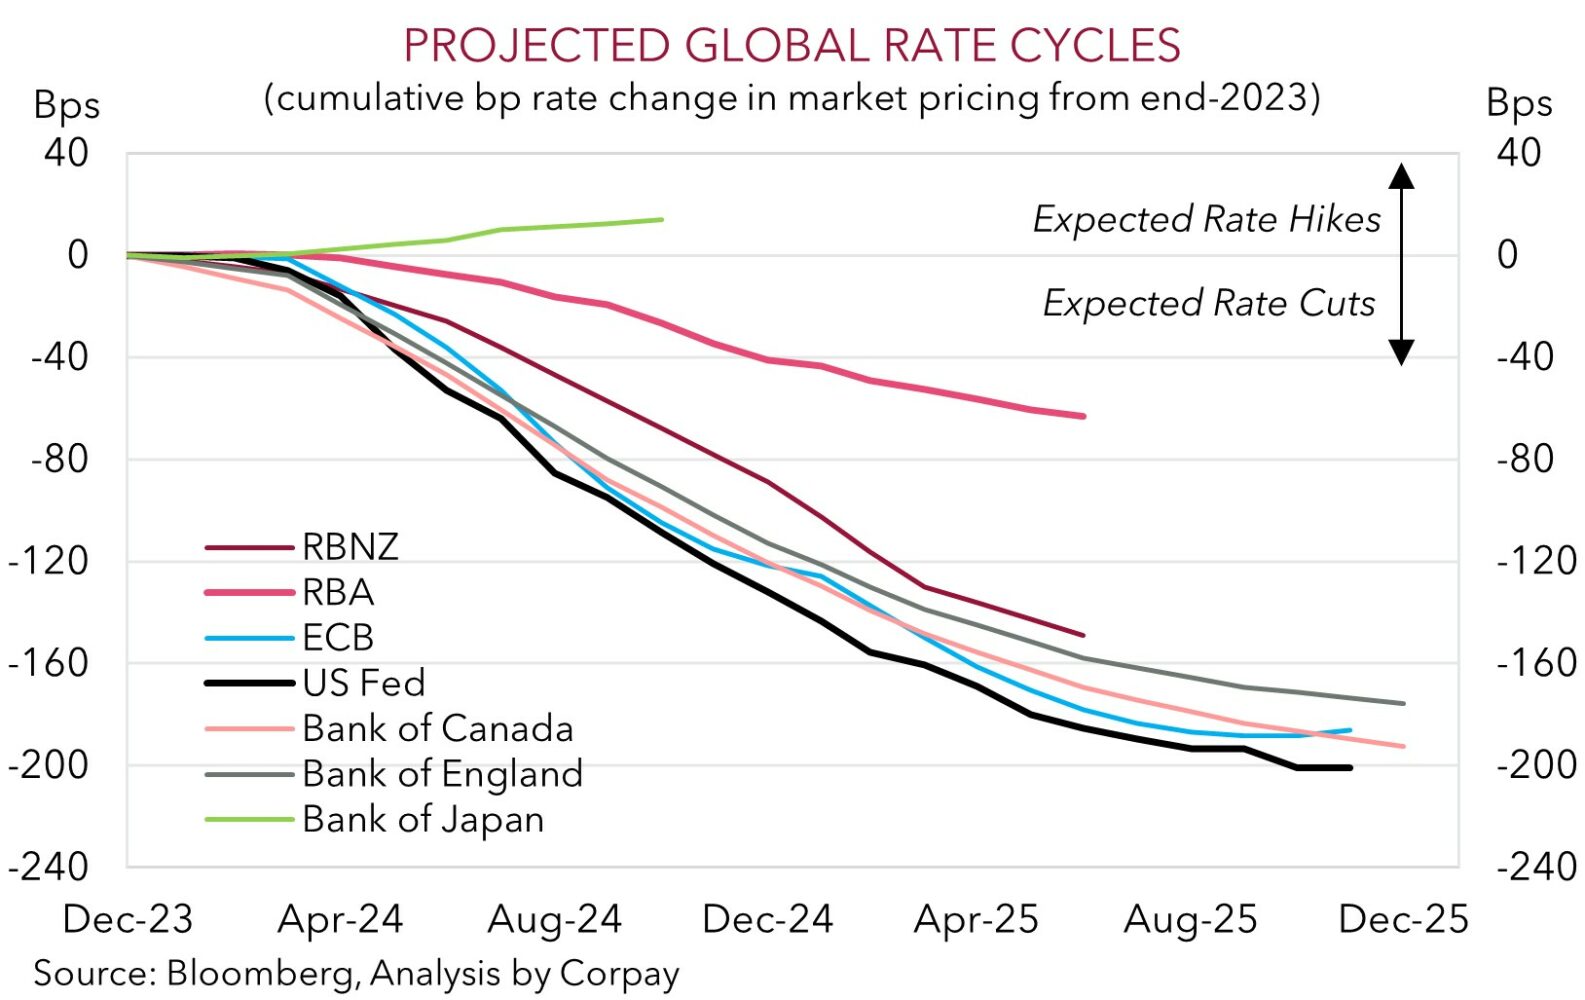
(c) Inflation and central bank actions. Will inflation slow enough to enable central banks to begin to loosen policy later this year, or will labour market/economic resilience cause ‘sticky’ services inflation to persist compelling policymakers to keep rates higher for longer? (Chart 3)
On top of the intertwined macro uncertainties flagged is the geopolitical backdrop. The war in the Ukraine is still raging, as is the conflict between Israel and Hamas. An escalation (de-escalation) of either could unnerve (boost) markets and/or have negative (positive) economic consequences via the impacts on trade, commodities, or financial conditions. Added to that 2024 will see several elections take place across the world that may trigger a re-evaluation and jolt markets. 2024 is being billed by some as one of the biggest election years in history with more than 60 nations (over half of the world’s population) heading to the ballot box. Last week’s vote in Taiwan is bookended by the 5 November US Presidential Election, with countries such as India, Indonesia, South Africa, Mexico, Iran, Russia, and the UK also heading to the polls this year. No doubt focus on the US election will gather pace as 2024 rolls on. Increasing or decreasing chances former President Trump regains the White House could cause market gyrations as his economic agenda, fears of a renewed trade war with China, and what it could mean for Fed policy and capital flows are discounted.
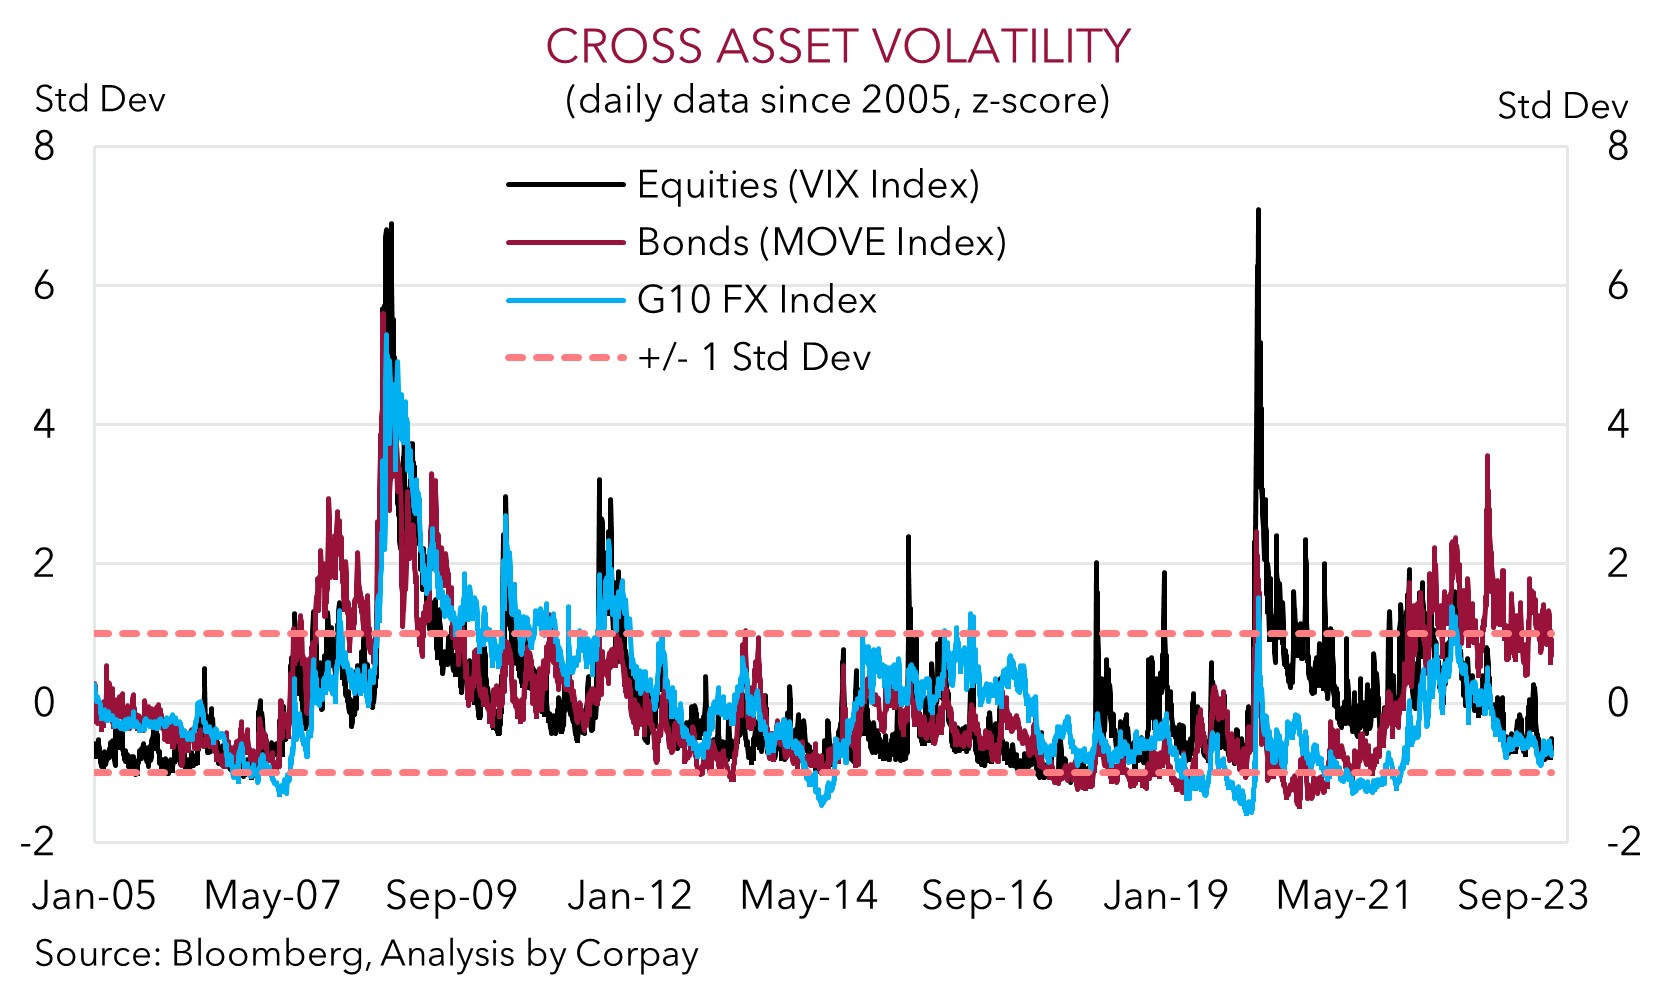
The various combinations and permutations suggest bursts of volatility could be common in 2024 as tensions play out. Especially when you consider measures of implied volatility across various assets classes indicate markets are penciling in a relatively benign environment (Chart 4).
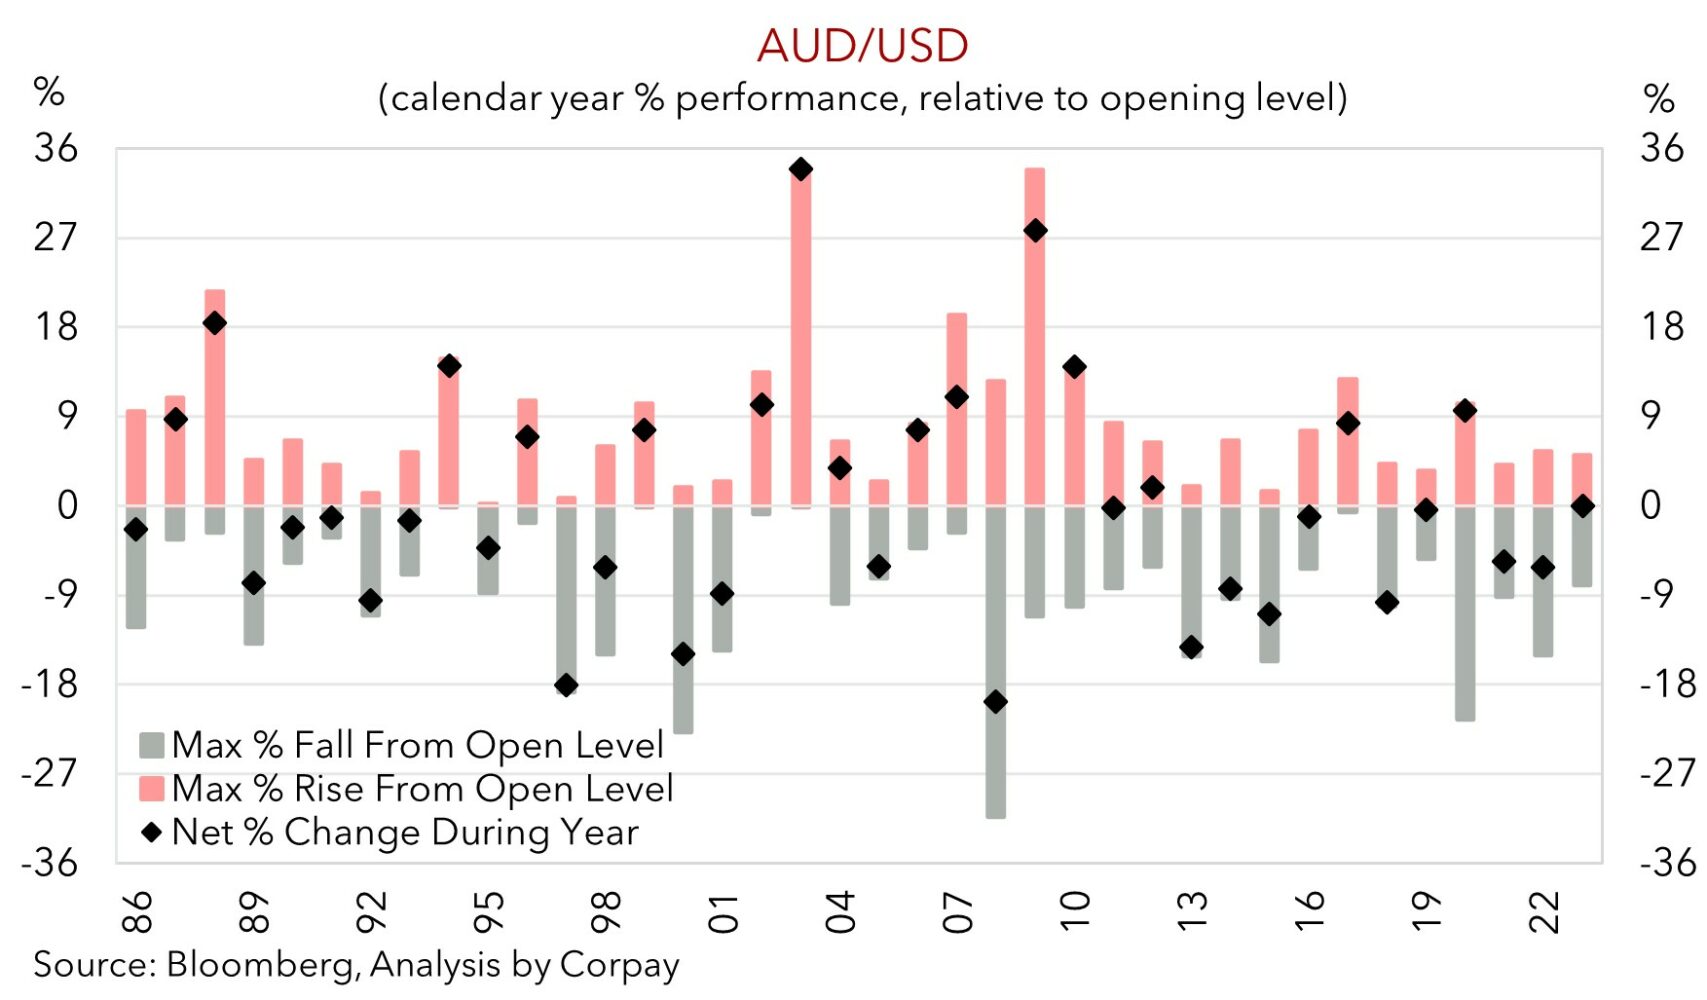
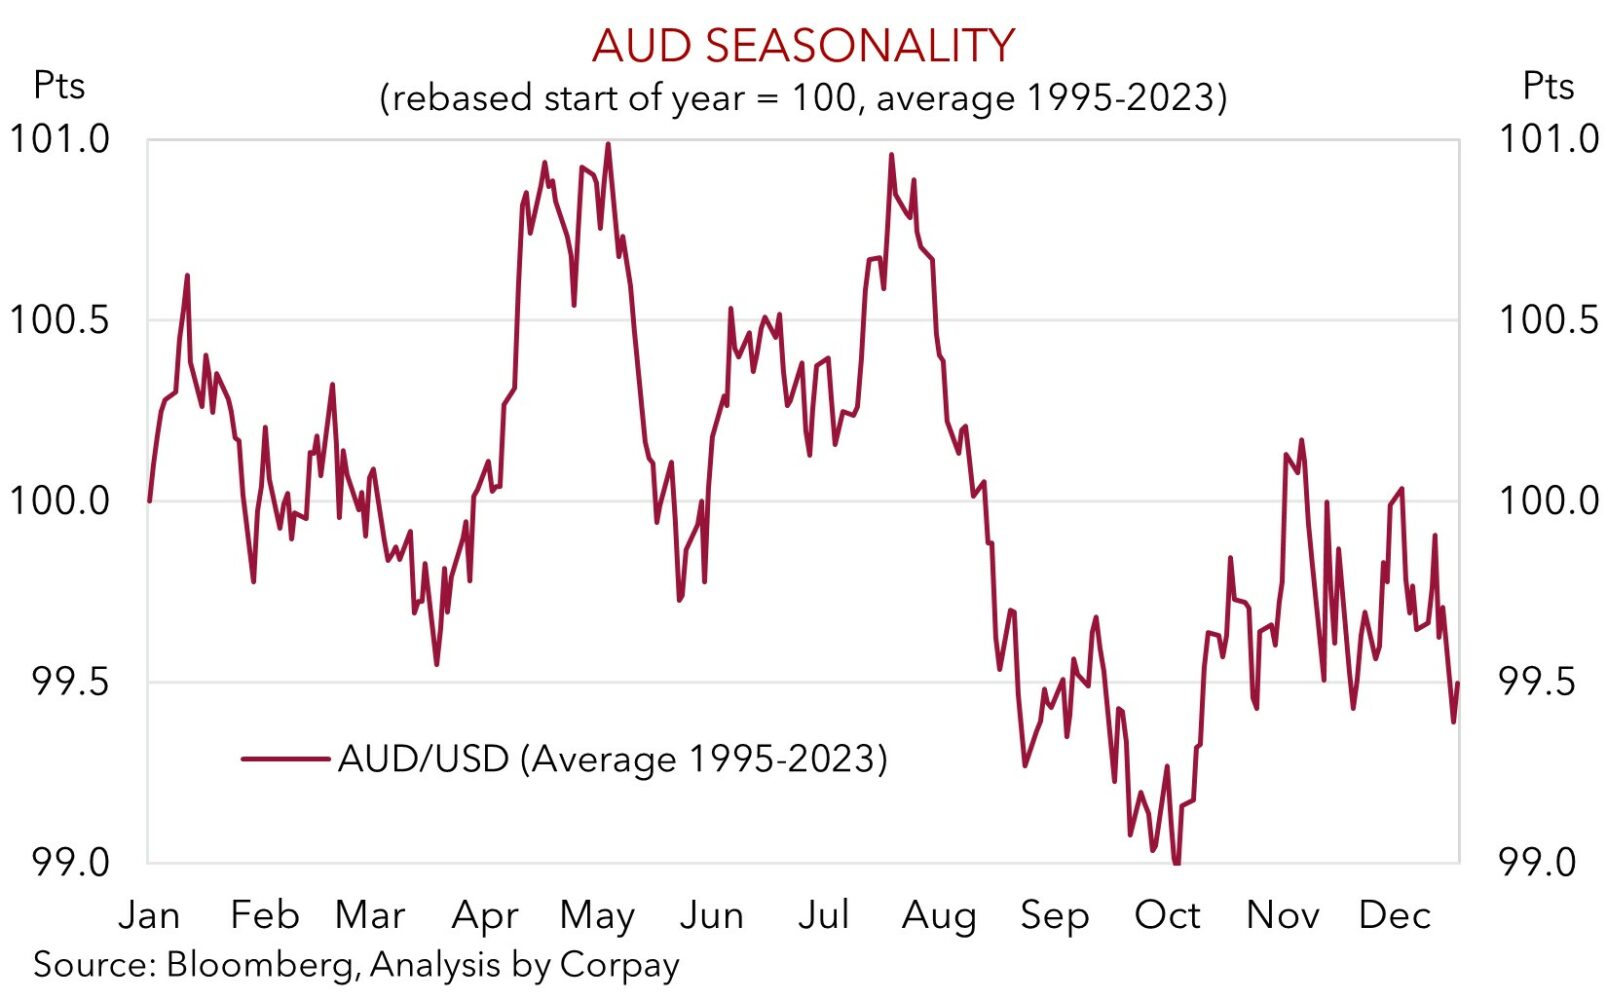
It is worth remembering that the AUD is an inherently volatile currency and markets seldom move in straight lines. Since the mid-80s the AUD has, on average, traded in a 3.1 cent range each month. Consequently, in the 40-years since the float the AUD has, on average, traded in a ~20% (or ~13 cent) calendar year range. Within that the AUD has, on average, experienced a ~8.5% intra-year rally and a ~9.5% intra-year drawdown relative to its opening levels (Chart 5). Based on where the AUD started 2024, and with these parameters in mind, a conceivable range the AUD could oscillate between this year is ~$0.62 to ~$0.74. This is not overly different to 2023 with similar seasonal patterns also possible. As our past research showed the AUD tends to underperform in January, and more so in May and August, while it has more often than not appreciated during February, April, and over Q4 (see Market Musings: History doesn’t repeat, but…) (Chart 6).
All in all, while we hold a positive medium-term bias for the AUD, there will be bumps along the way. The laundry list of uncertainties and flashpoints points to the AUD trading in a fairly wide range once again this year. The AUD’s volatility over the past few weeks could be a taste of things to come meaning FX hedging may need to be more active, nimble, or shorter-dated than many might have become used to. We believe exports/importers should continuously assess the lay of the land and be prepared to strike when the iron is hot to opportunistically take advantage of any sizeable drops/rallies in the AUD away from prevailing ‘fair-value’ estimates. For the record, as at today, the average across our suite of AUD ‘fair value’ models is sitting at ~$0.6850, a little over 4% above current spot.
