The AUD has had the wind at its back over the past few weeks with an over 5% jump from its late-April Israel/Iran risk aversion lows coming through. This has pushed AUD/USD (now ~$0.6690) to a ~4-month high. The AUD has also outperformed on many of the major crosses. AUD/EUR (now ~0.6145) and AUD/GBP (now ~0.5271) are hovering at the upper end of their respective multi-month ranges. AUD/CAD (now ~0.91) touched its highest level since last June, AUD/CNH (now ~4.83) is back up where it was in early-January, and despite a modest dip more recently AUD/NZD (now ~1.0920) is also north of its 1-year average.
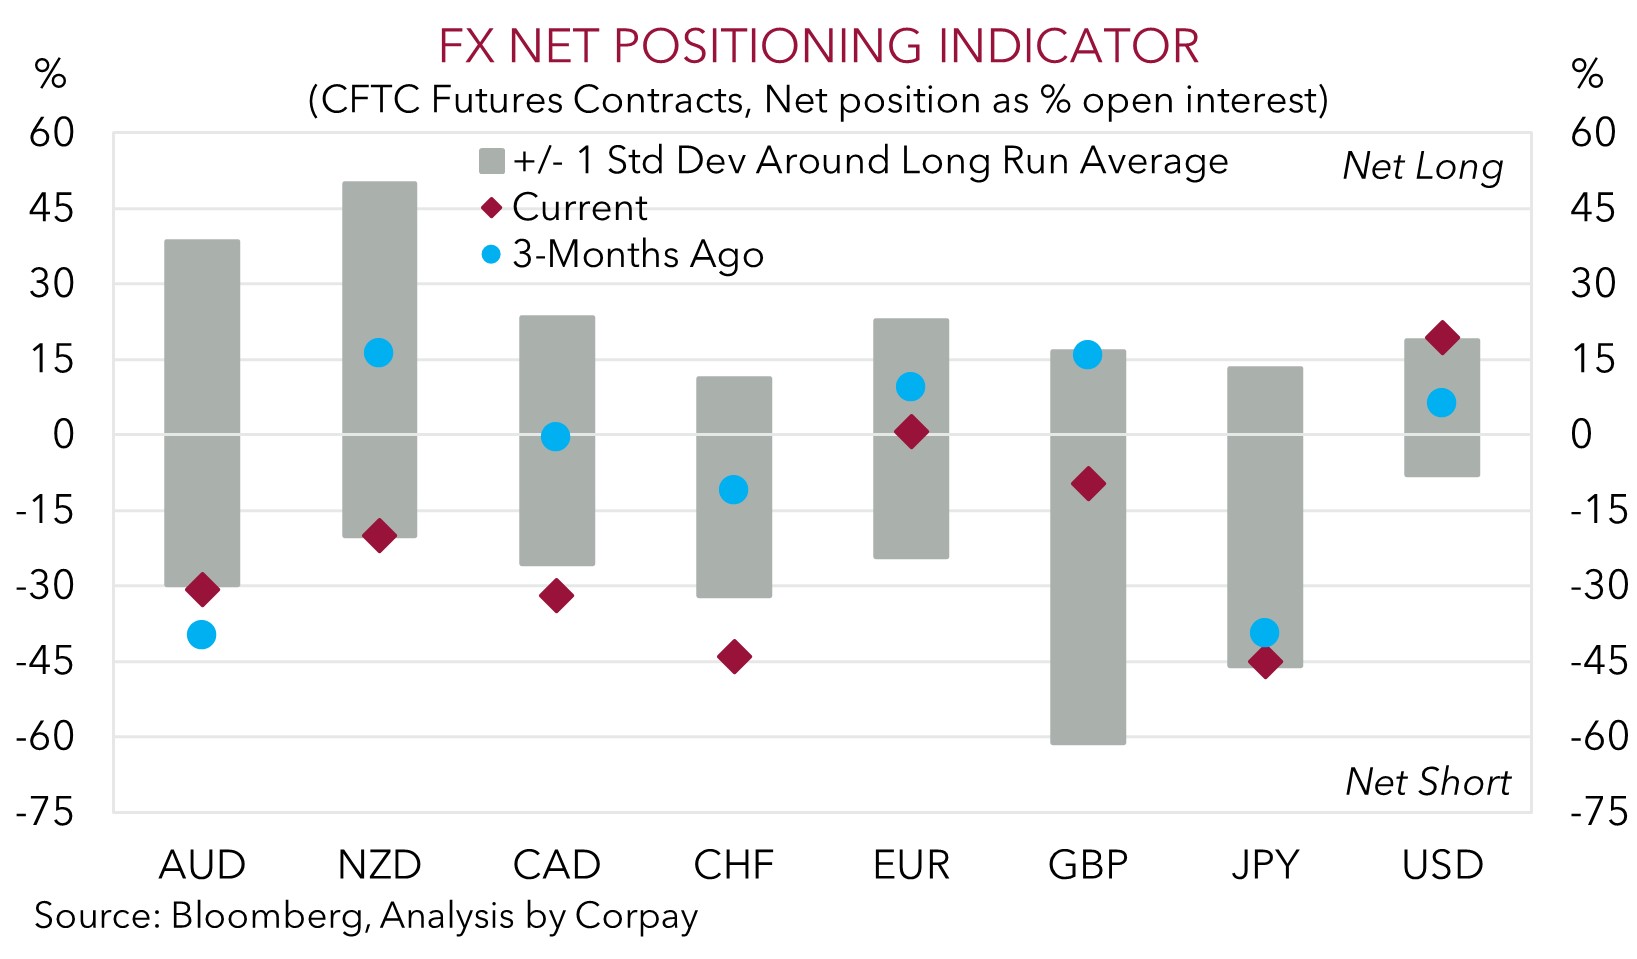
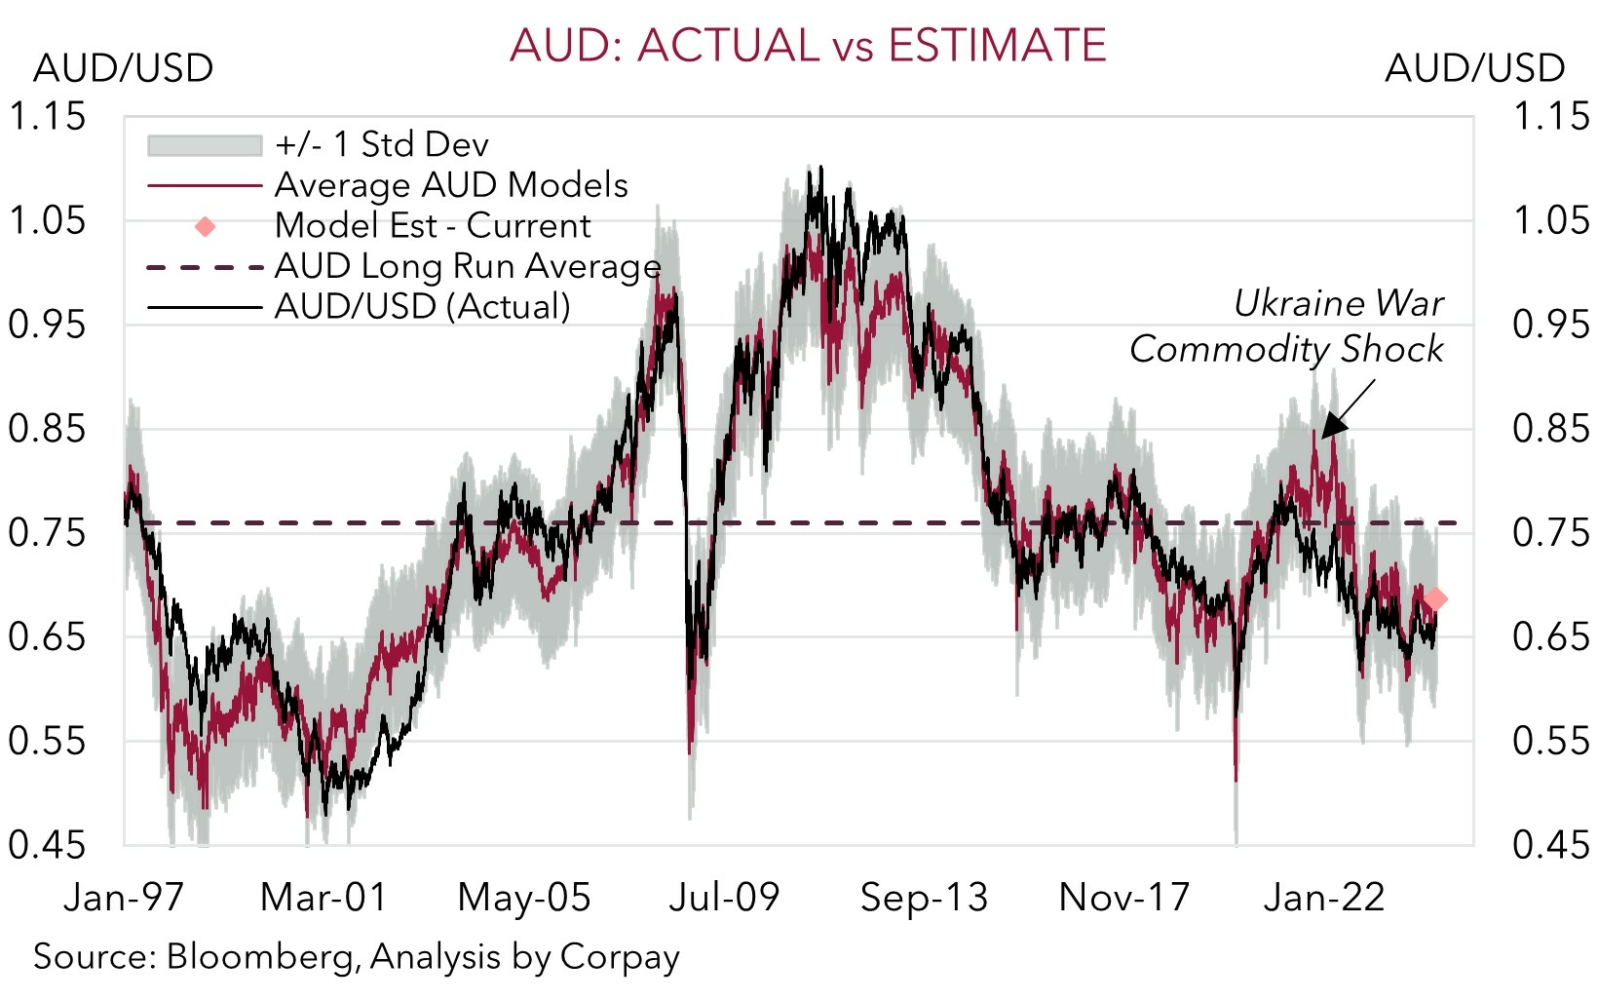
Throughout the short-term gyrations in risk markets over the past few months we have held a positive medium-term bias towards the AUD. Markets don’t move in a straight line, and more intermittent bouts of volatility should be anticipated. However, overall, we think there is scope for the AUD to add to its gains over the period ahead based on the shifts in various underlying drivers, and as still excessively bearish ‘net short’ positioning (as measured by CFTC futures) is pared back (chart 1). The average across our suite of models suggests AUD ‘fair value’ is now a touch above ~$0.68 (chart 2), with other pairs such as AUD/EUR and AUD/GBP also looking ~2-3 cents too low compared to where relative long-term rate differentials are tracking.
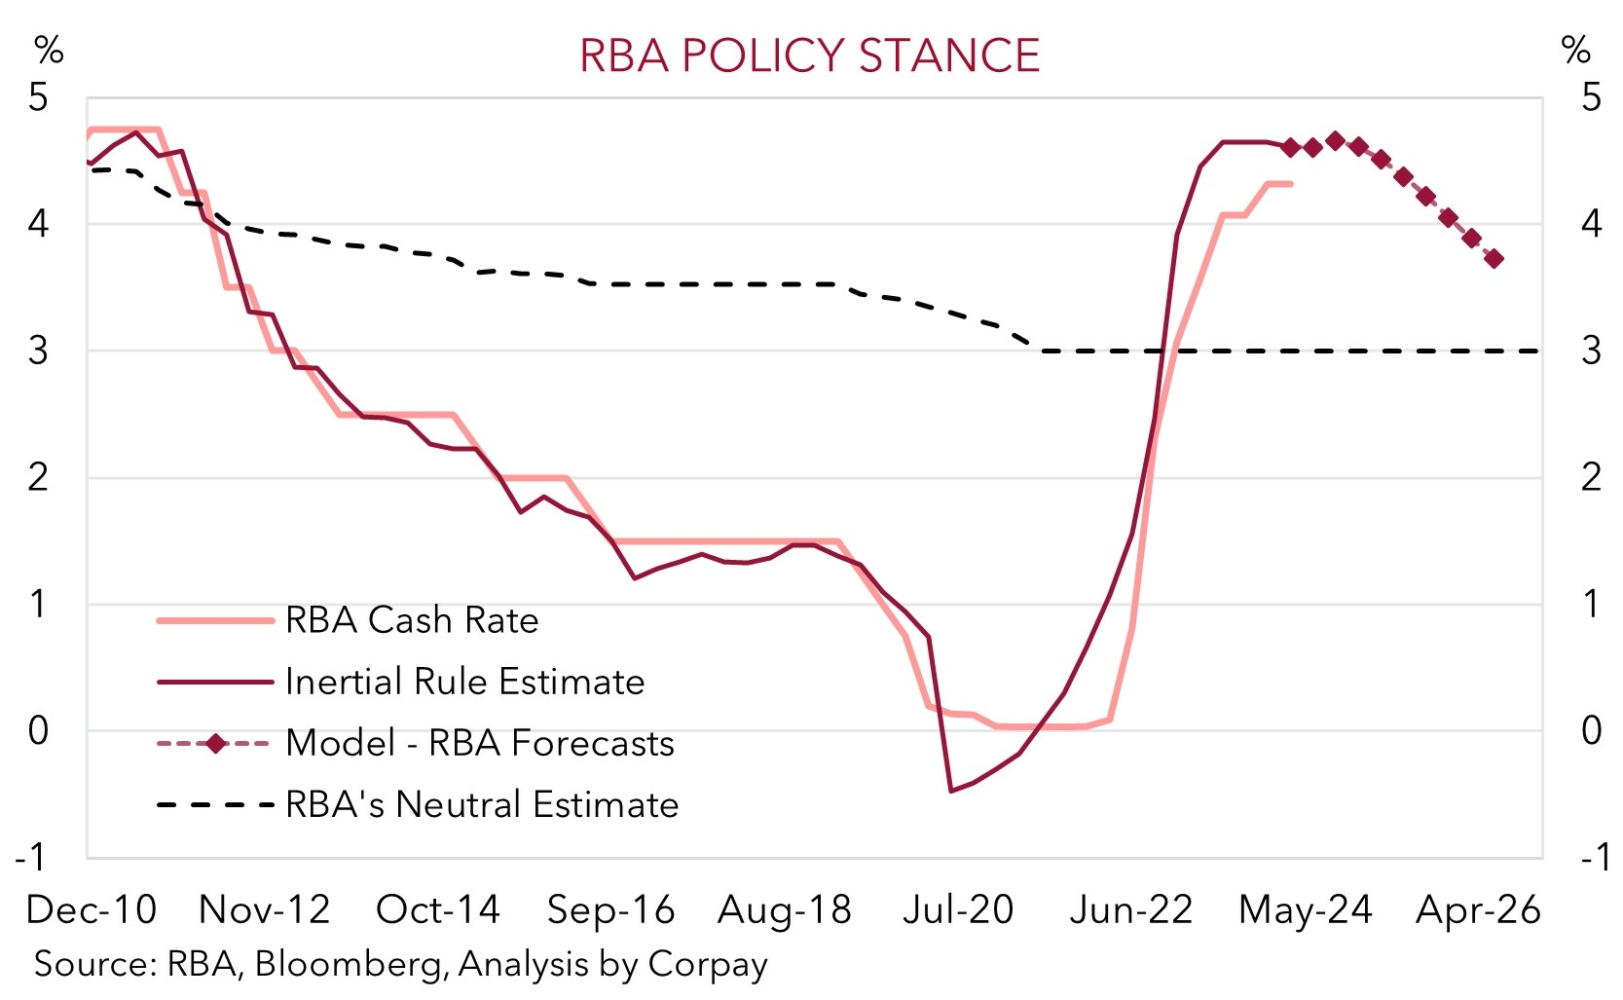
A core pillar underpinning our constructive AUD view has been our long-standing assumption that when it comes to interest rates the RBA would lag its major counterparts in terms of when it starts and how far it goes during the next global monetary policy easing cycle. For one, our modelling finds that the RBA may not have raised rates high enough to begin with, with the current 4.35% cash rate ~50bps below where our Taylor Rule estimate implies it ought to be (chart 3). This higher level would also be more in line with where interest rates reached in comparable economies like Canada, the UK, and NZ.
All else equal, the RBA’s relatively more measured approach during the tightening phase, in its efforts to not inflict too much damage across the economy and preserve as many of the COVID-era job gains as possible, also means that: (i) it will probably need to keep rates at current levels for a longer time in order for the ‘not as restrictive settings as they should be’ to work; and/or (ii) it is likely to lower interest rates gradually when the time comes, especially when also considering the fiscal measures that are flowing. Income support from the stage 3 tax cuts will start to hit the household sector from 1 July, while indirect savings created by other cost of living relief measures unveiled in the Federal Budget could also be re-circulated into the economy from Q3.
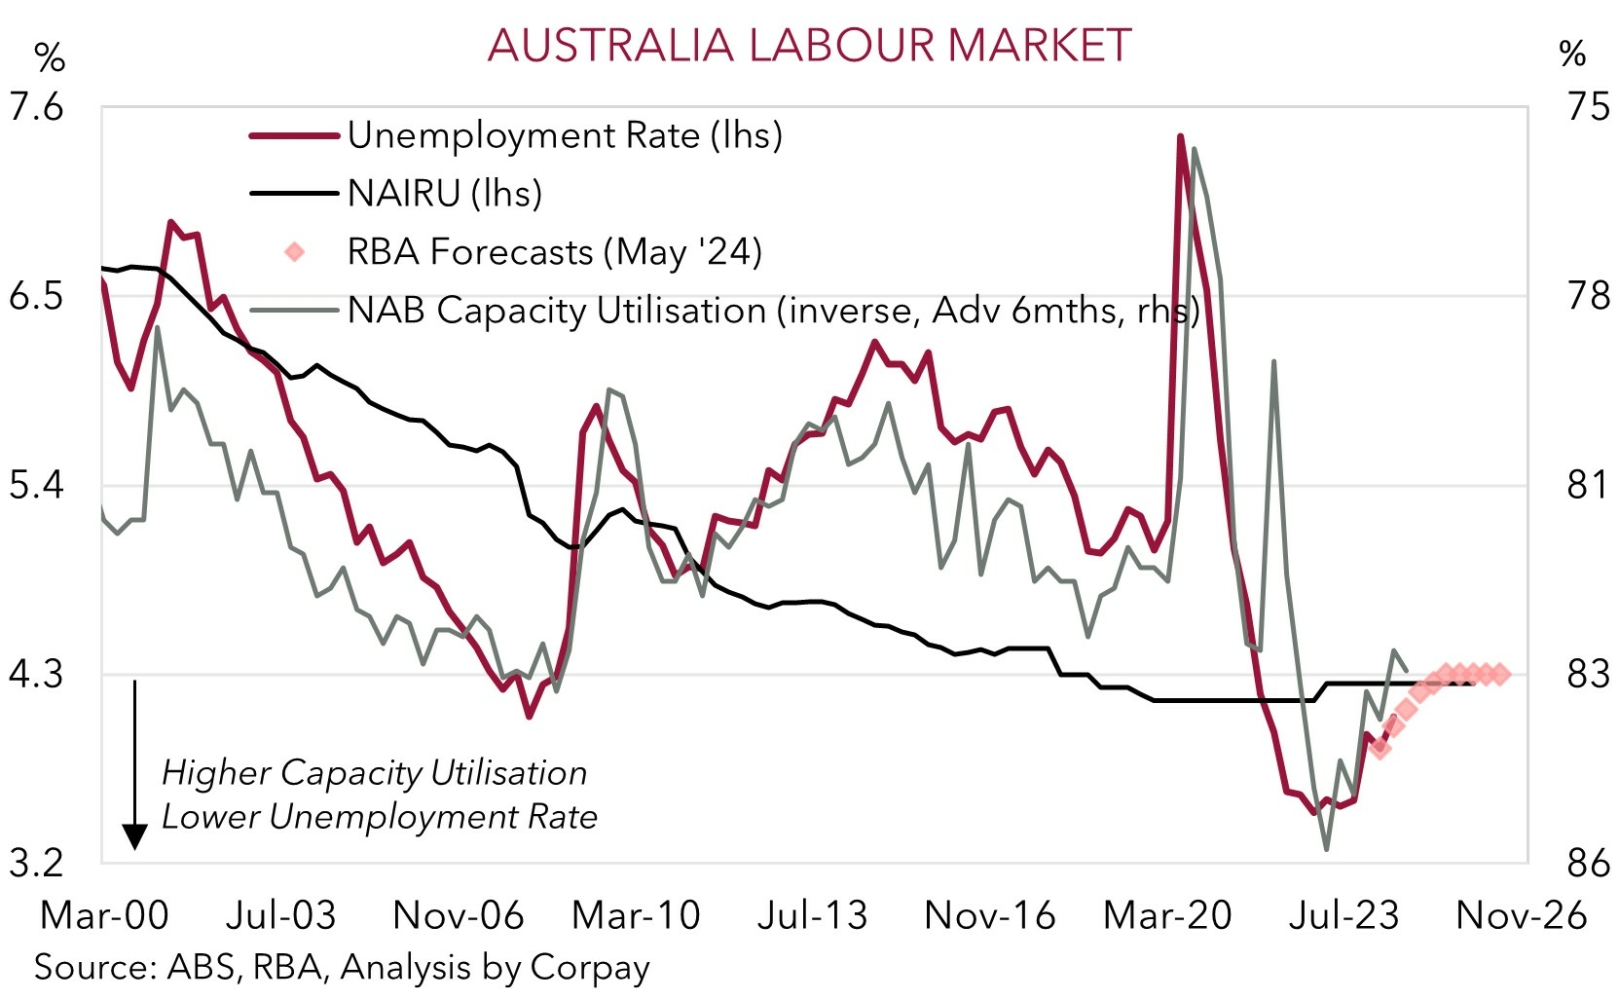
Indeed, while Q1 wages and the April jobs report underwhelmed consensus projections and show that conditions are loosening, as per the signal from various leading indicators such as job ads and hiring intentions, perspective is needed. It hasn’t been that abrupt. Australia’s unemployment rate nudged up to 4.1% in April, ~0.6%pts above last years historic lows, but this is still below estimates of ‘full employment’ with much of the gentle upturn due to greater labour supply thanks to robust population growth rather than job losses (chart 4). Although employment is running at an above average 2.8%pa pace, the labour force is expanding more briskly. Moreover, we see some chance the April labour force data was ‘more noise than signal’ with unemployment potentially slipping back in May. The ABS noted that in April “more people than usual” deemed to be out of work “had a job that they were waiting to start in”. Something similar occurred in early-2024.
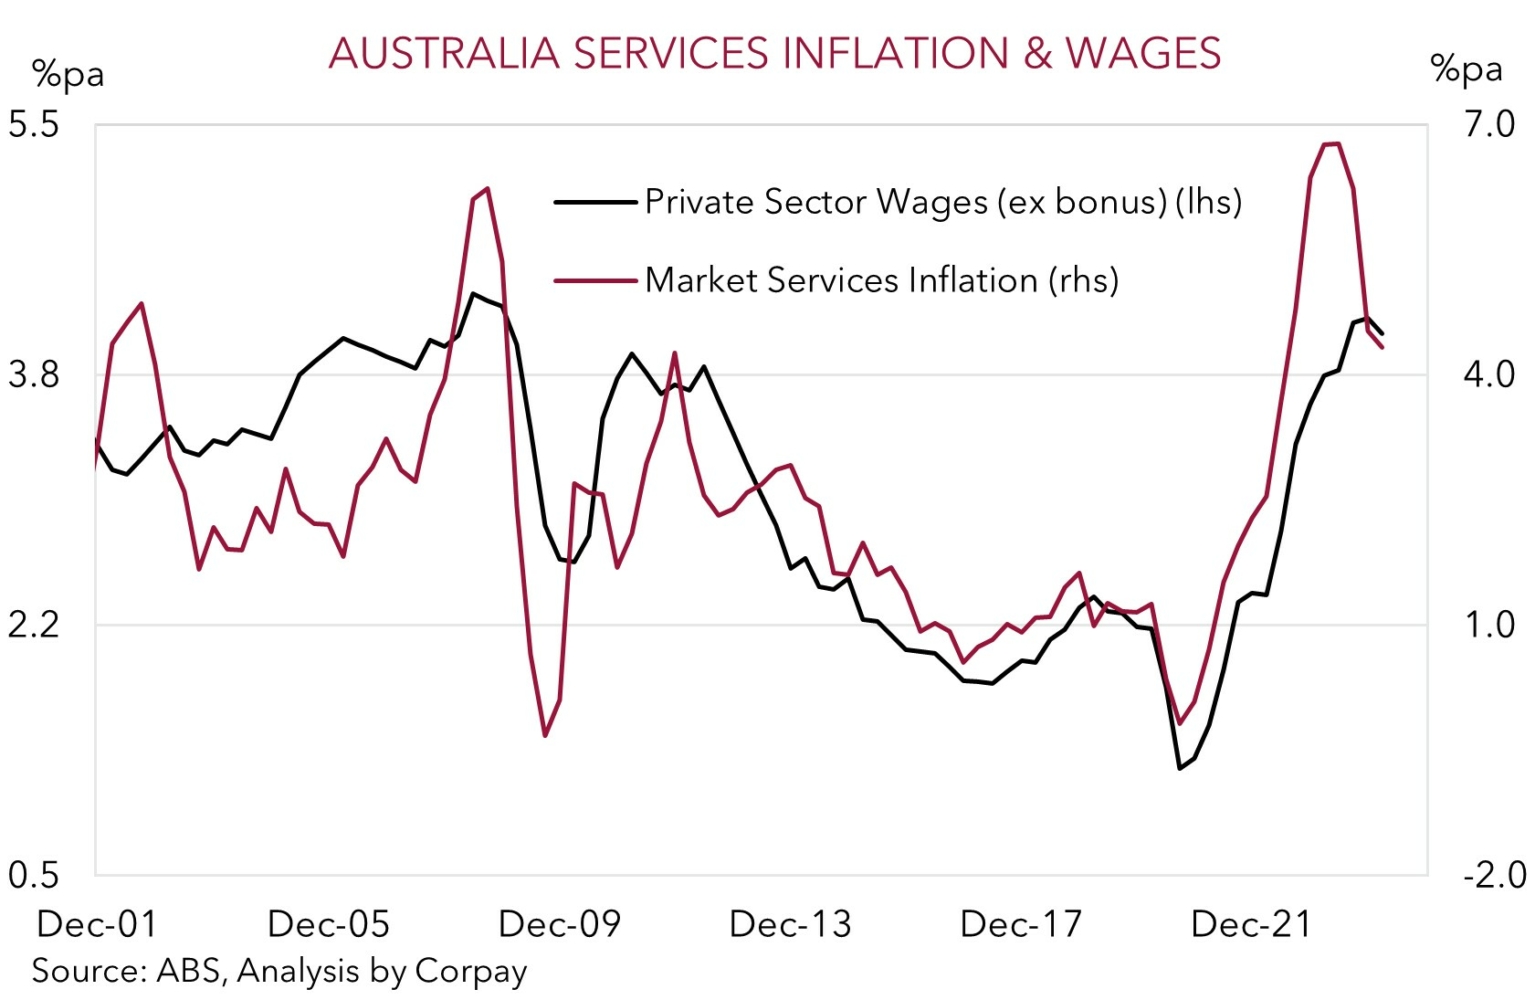
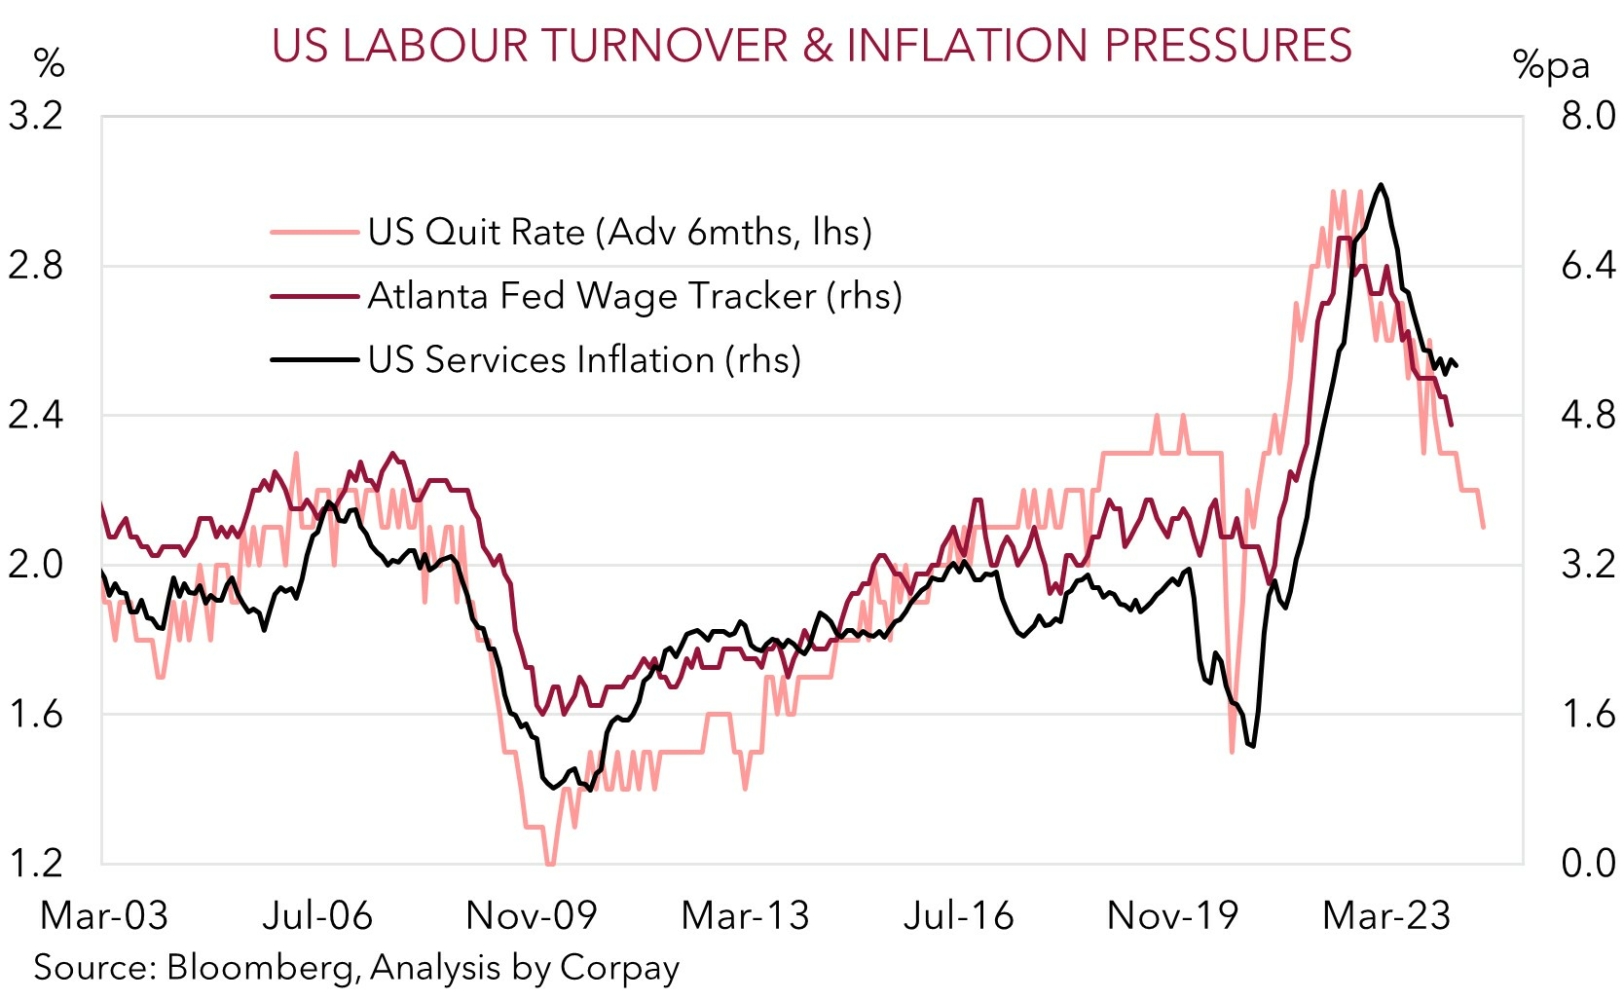
From our perspective, the still ‘tightish’ labour market conditions, elevated wages and rents, and Australia’s lackluster productivity means the services/core inflation challenge is far from won (chart 5). This might keep the RBA’s guard up for a while yet, in our view. By contrast, the latest read on US CPI inflation showed underlying inflation pressures moderated. This should be somewhat of a comfort for US Fed policymakers. After the Q1 positive surprises things in the US look to be beginning to trend in the right direction once again. US core inflation has decelerated to its slowest pace in 3-years (now 3.6%pa), and leading indicators for US wages and services inflation like the ‘quit rate’ (a gauge of job churn) are pointing to further improvement over coming months (chart 6). This, combined with a slowdown in US economic activity as the lagged impacts from tighter monetary/credit conditions and below par consumer and business confidence bite might further revive US Fed rate cut expectations. If realised, we believe this would exert more downward pressure on US bond yields and the USD (and upward pressure on the AUD). Other central banks like the ECB, BoE, and BoC also appear set to begin their interest rate cutting cycles over the next few months given the weaker economic situation and/or more convincing downtrend in inflation they are experiencing.
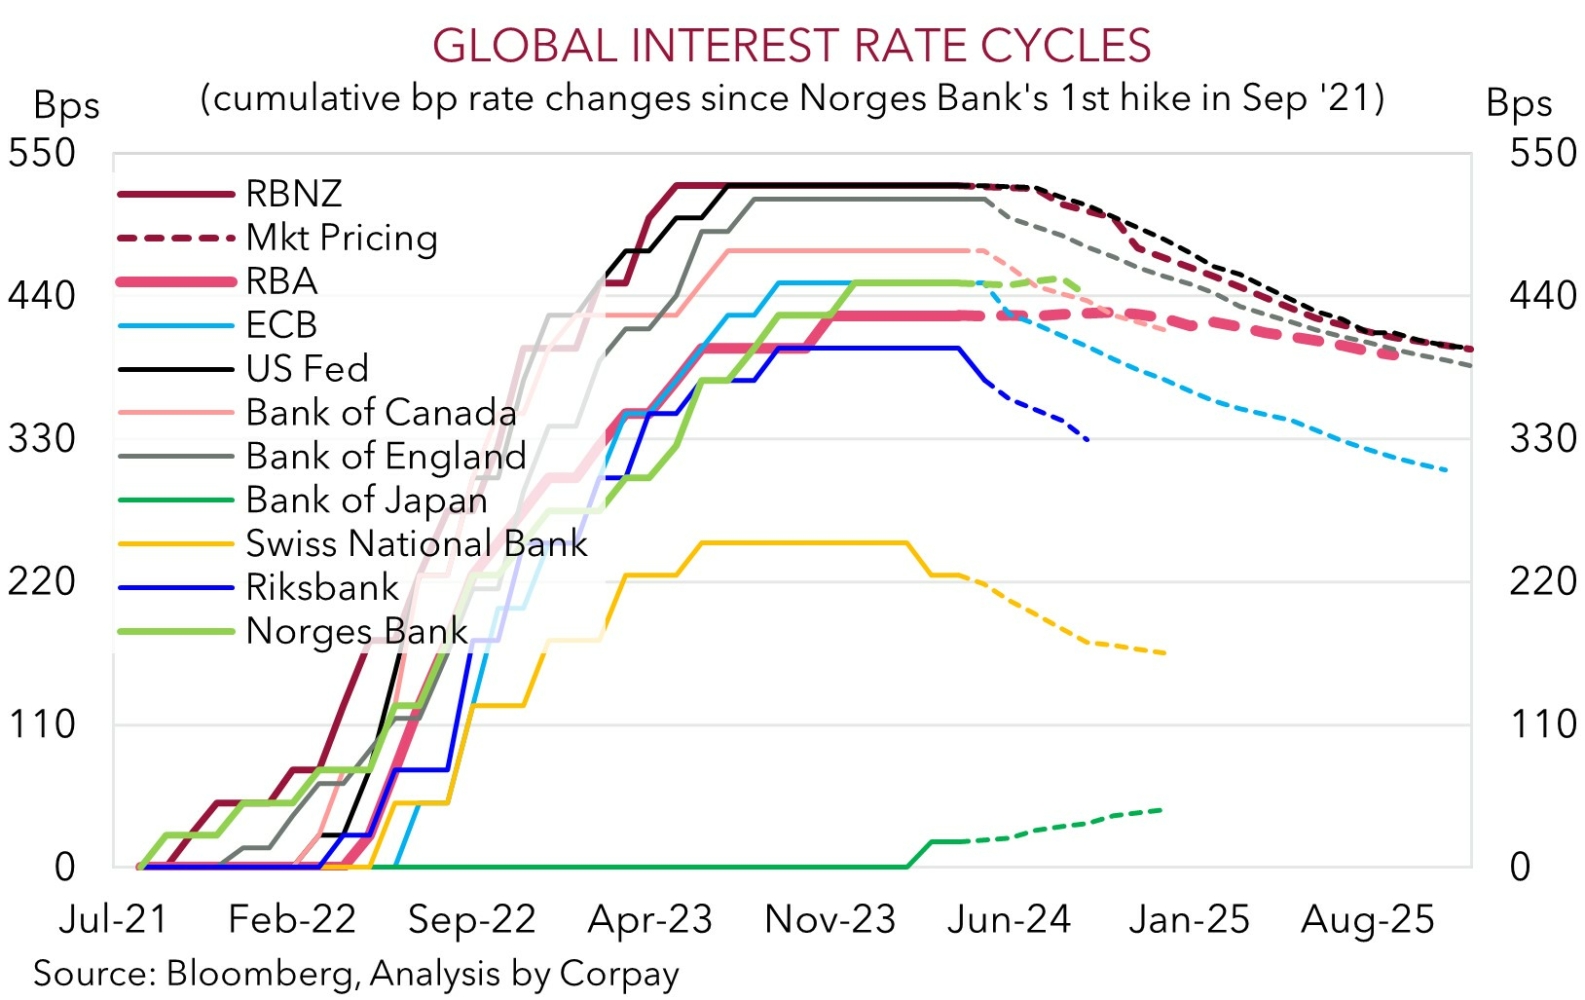
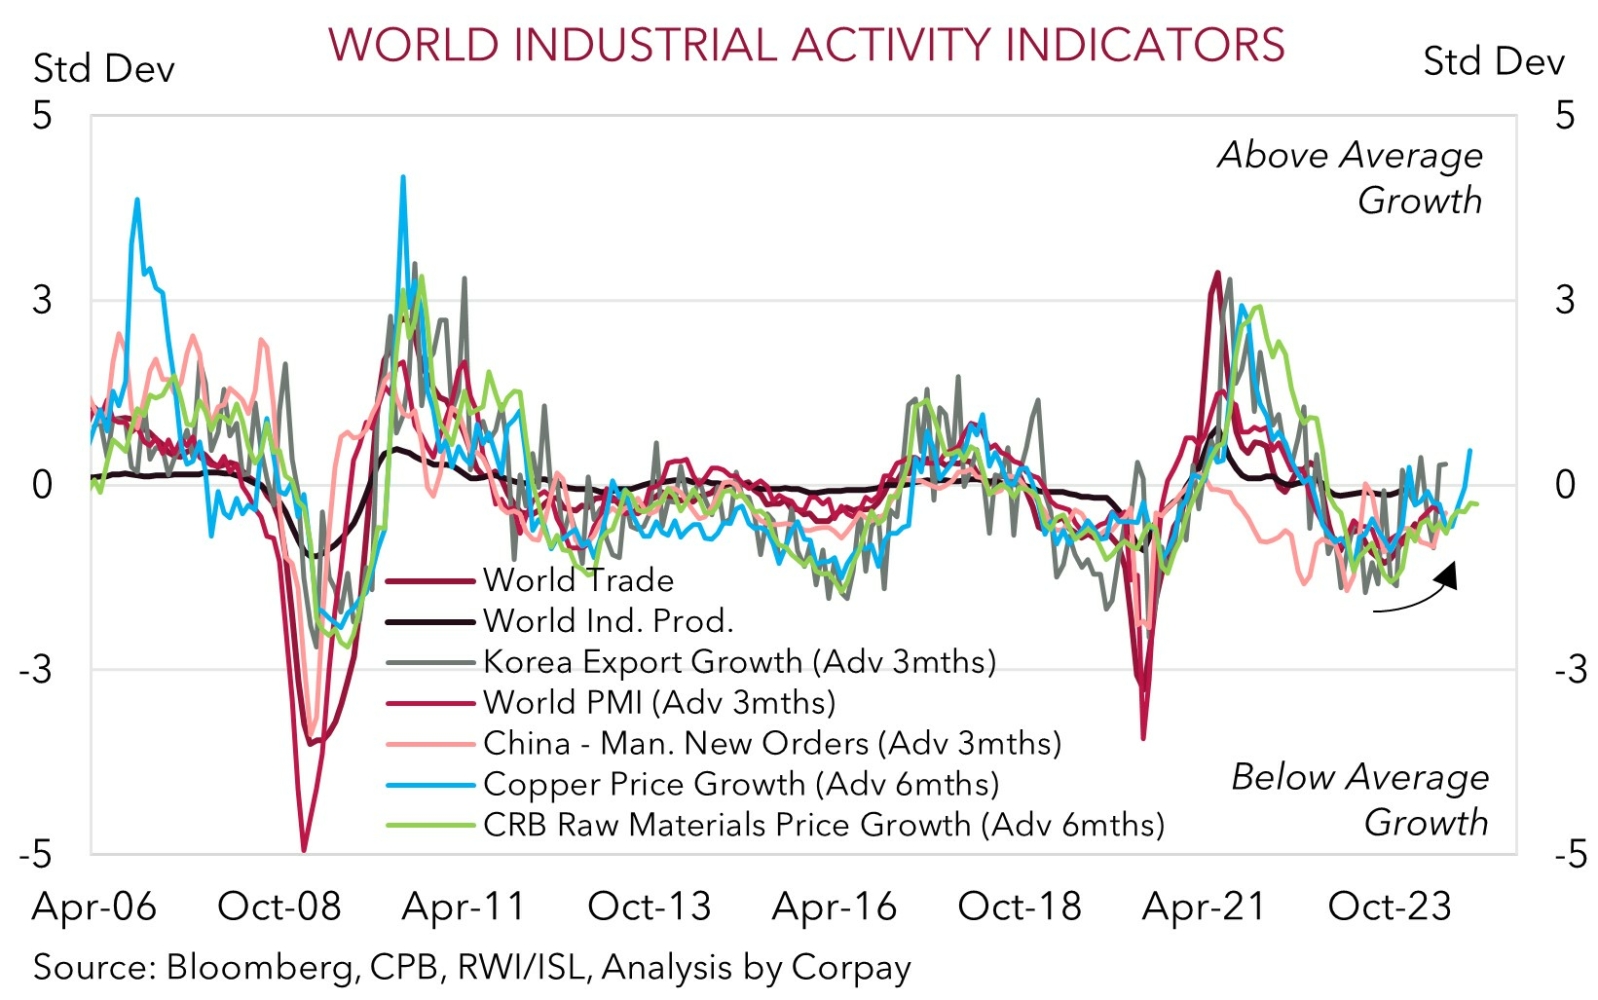
In addition to the diverging monetary policy expectations between the RBA and most of its major central bank peers (chart 7), which we feel should see yield differentials progressively turn more AUD supportive over time, the external backdrop is also becoming more positive. The AUD is a cyclical currency that is correlated to global industrial activity. And on this front various forward indicators that we monitor such as raw material demand and the copper price are signaling improved momentum over H2 (chart 8). The unfolding turnaround in China’s economy, particularly across the commodity-intensive industrial production/infrastructure side, as various stimulus measures gain traction is a key part of this story.

