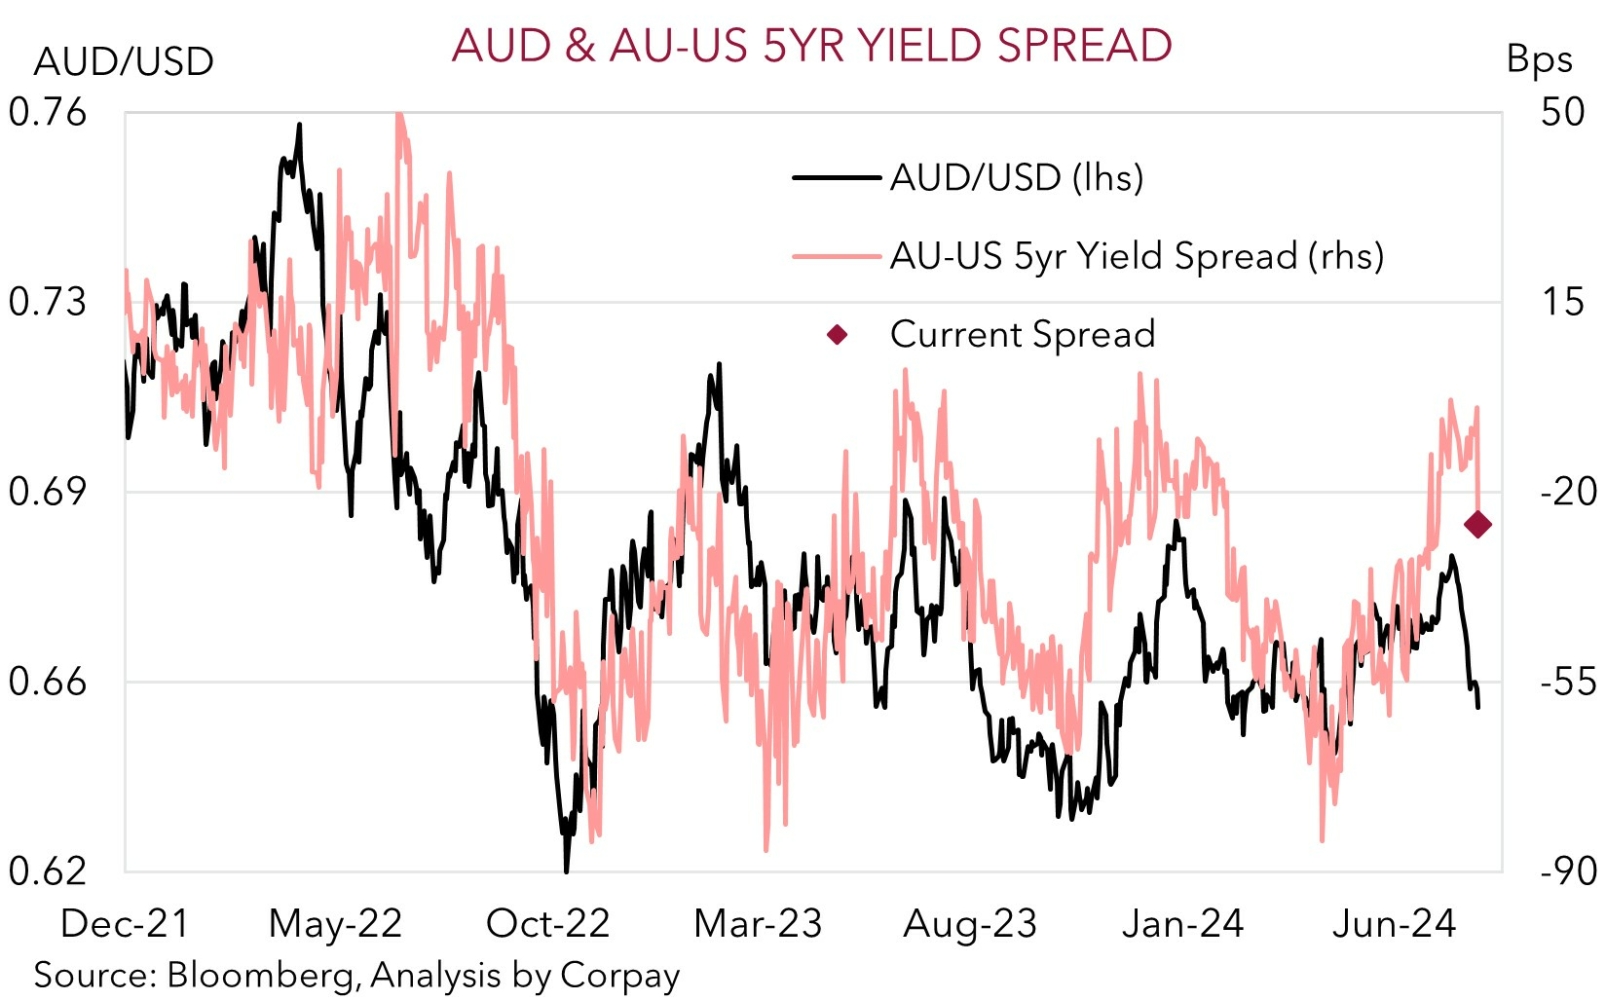
A surprise in the Q2 AU CPI, though for the first time in a few months it looks a bit more favourable for indebted households and businesses. While headline CPI nudged up inline with consensus forecasts to 3.8%pa, the important core inflation measure (i.e. the trimmed mean) was a touch softer than built up expectations. Core inflation rose 0.8% in Q2 with the annual rate slipping to 3.9%pa (chart 1). We think this should see the RBA hold fire and keep interest rates steady at its 6 August meeting. The unwind in Australian interest rate expectations, and paring back of near-term rate rise pricing has exerted knee-jerk downward pressure on the AUD (now $0.6495).
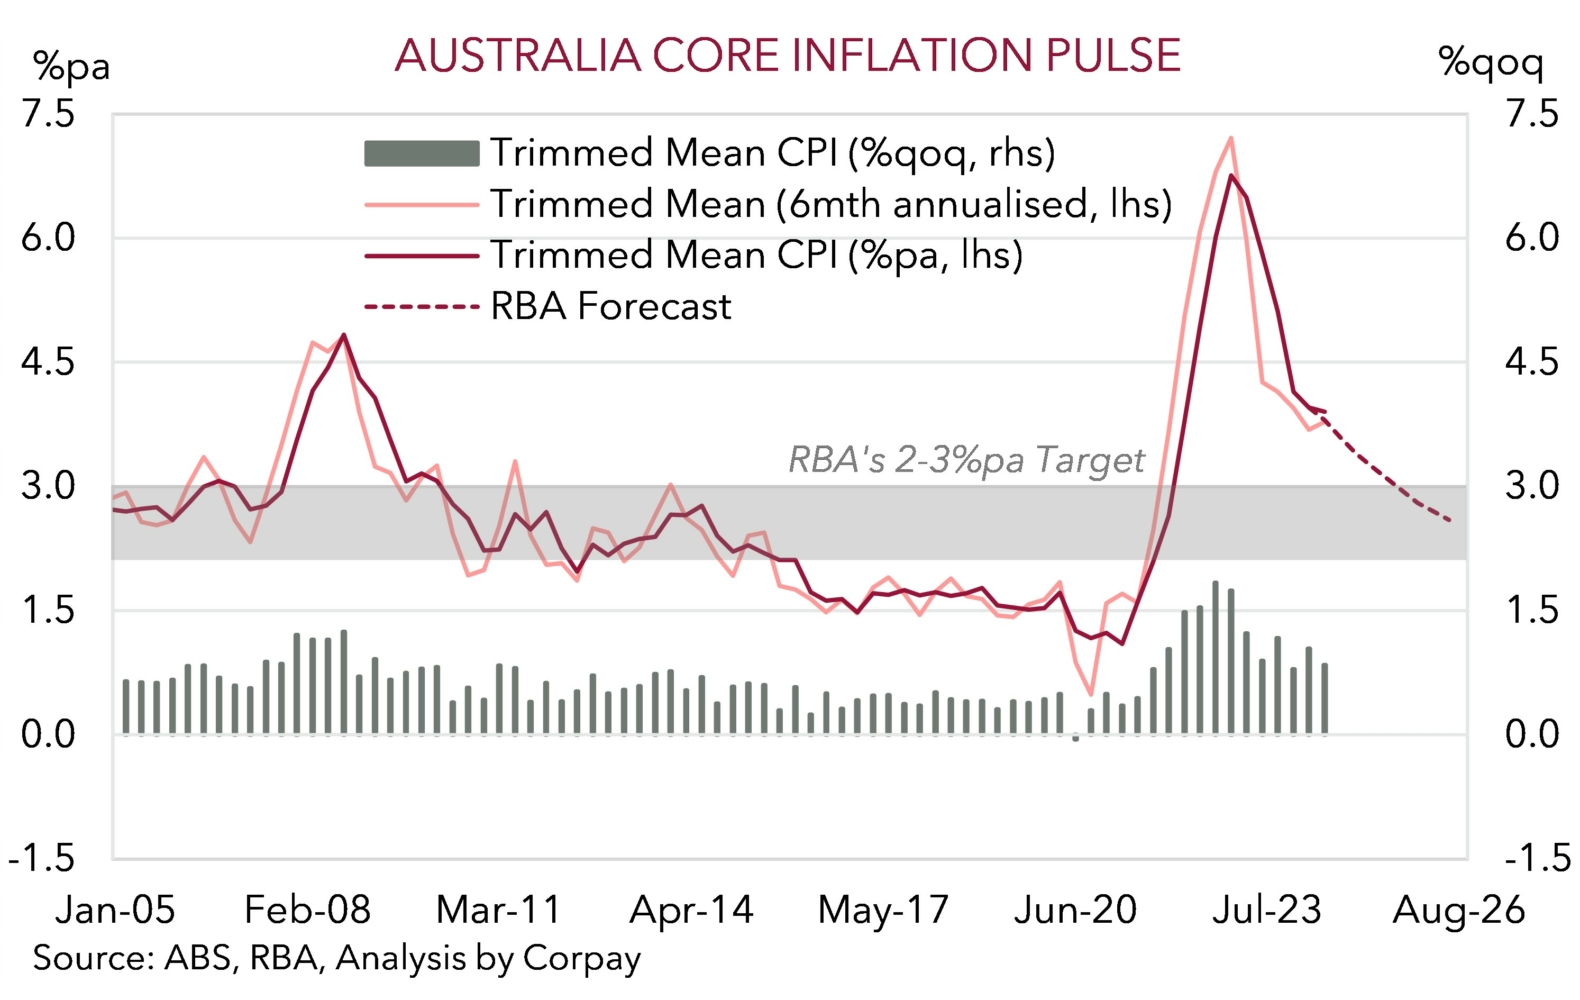
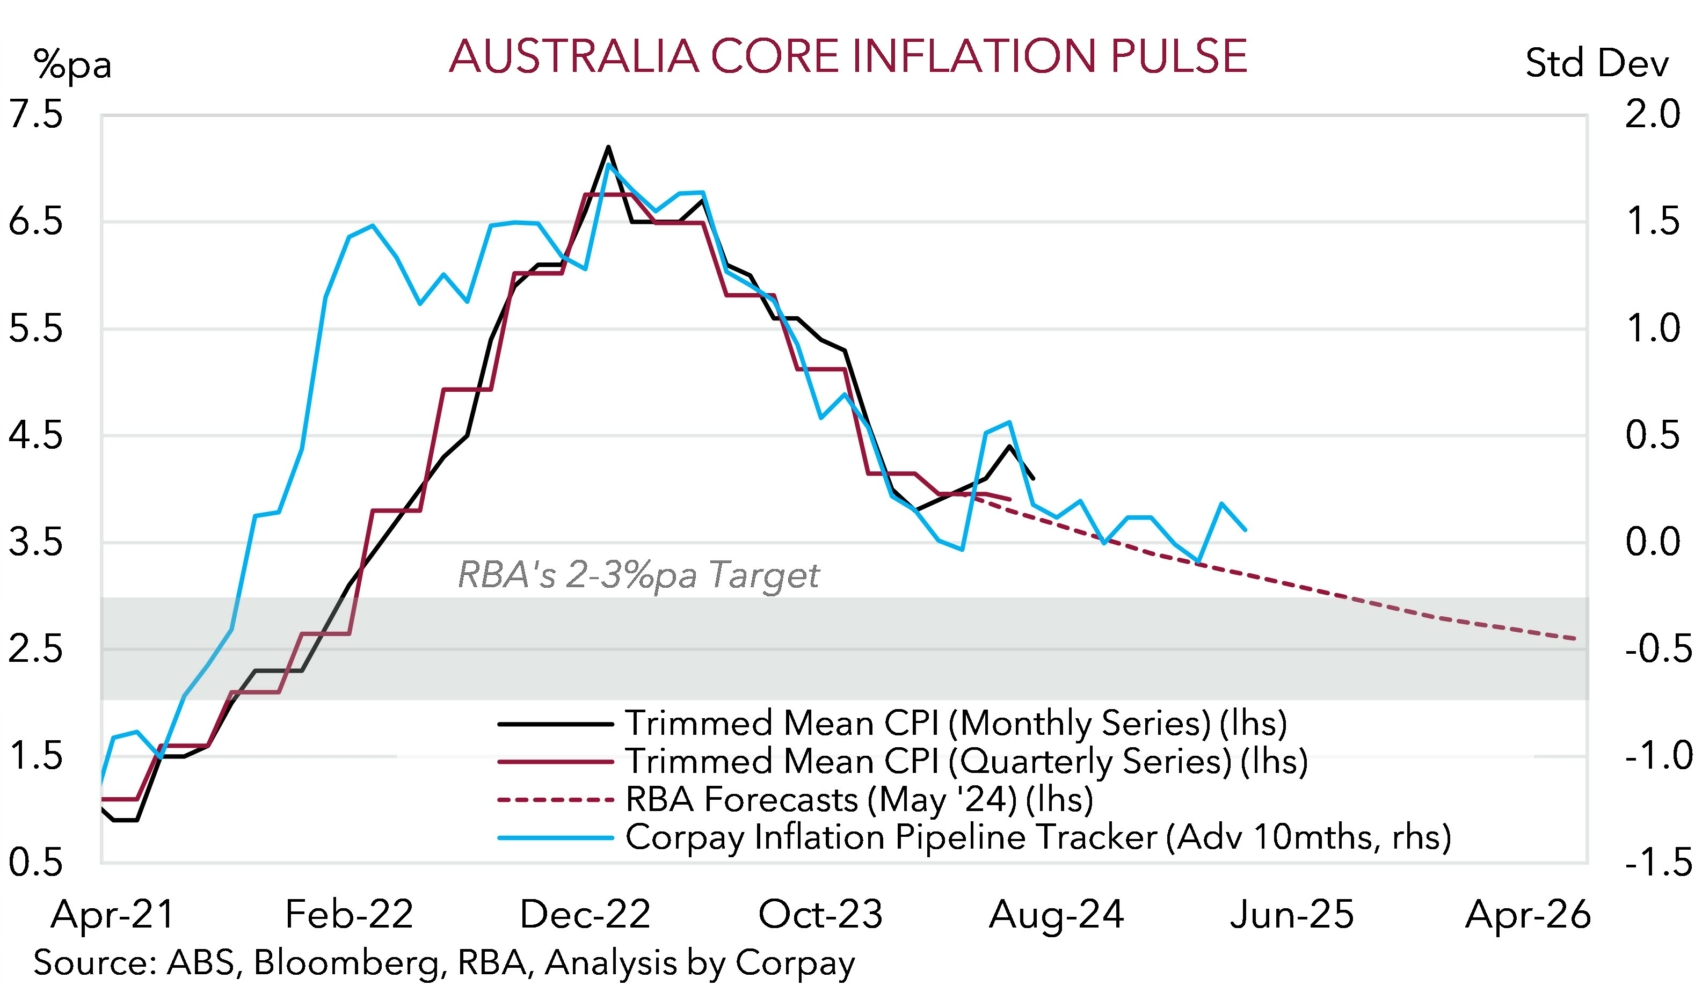
That said, a closer look at the underlying impulses continues to suggest interest rate relief and rate cuts are probably some time away, in our opinion. Broadly speaking, although the Q2 core inflation figures were below analysts’ predictions, the annual pulse did modestly exceed the RBA’s assumptions. Looking ahead, headline inflation will be artificially depressed over the next few quarters by government cost of living measures such as electricity rebates, however various trends point to the last leg of the downtrend in underlying inflation taking an extended period to play out. That is the signal coming from our forward-looking Inflation Pipeline Tracker (chart 2).
Economically, growth rates and momentum have stepped down, particularly on a per capita basis and across rate sensitive and ‘goods producing sectors’ on the back of higher interest costs, but the level of activity across the private sector (and services providing industries) is still above its pre-COVID trend. Various ‘spare capacity’ measures show that the Australian economy is operating in a state of ‘excess demand’. Unemployment is below full-employment and capacity utilization is above average (chart 3).
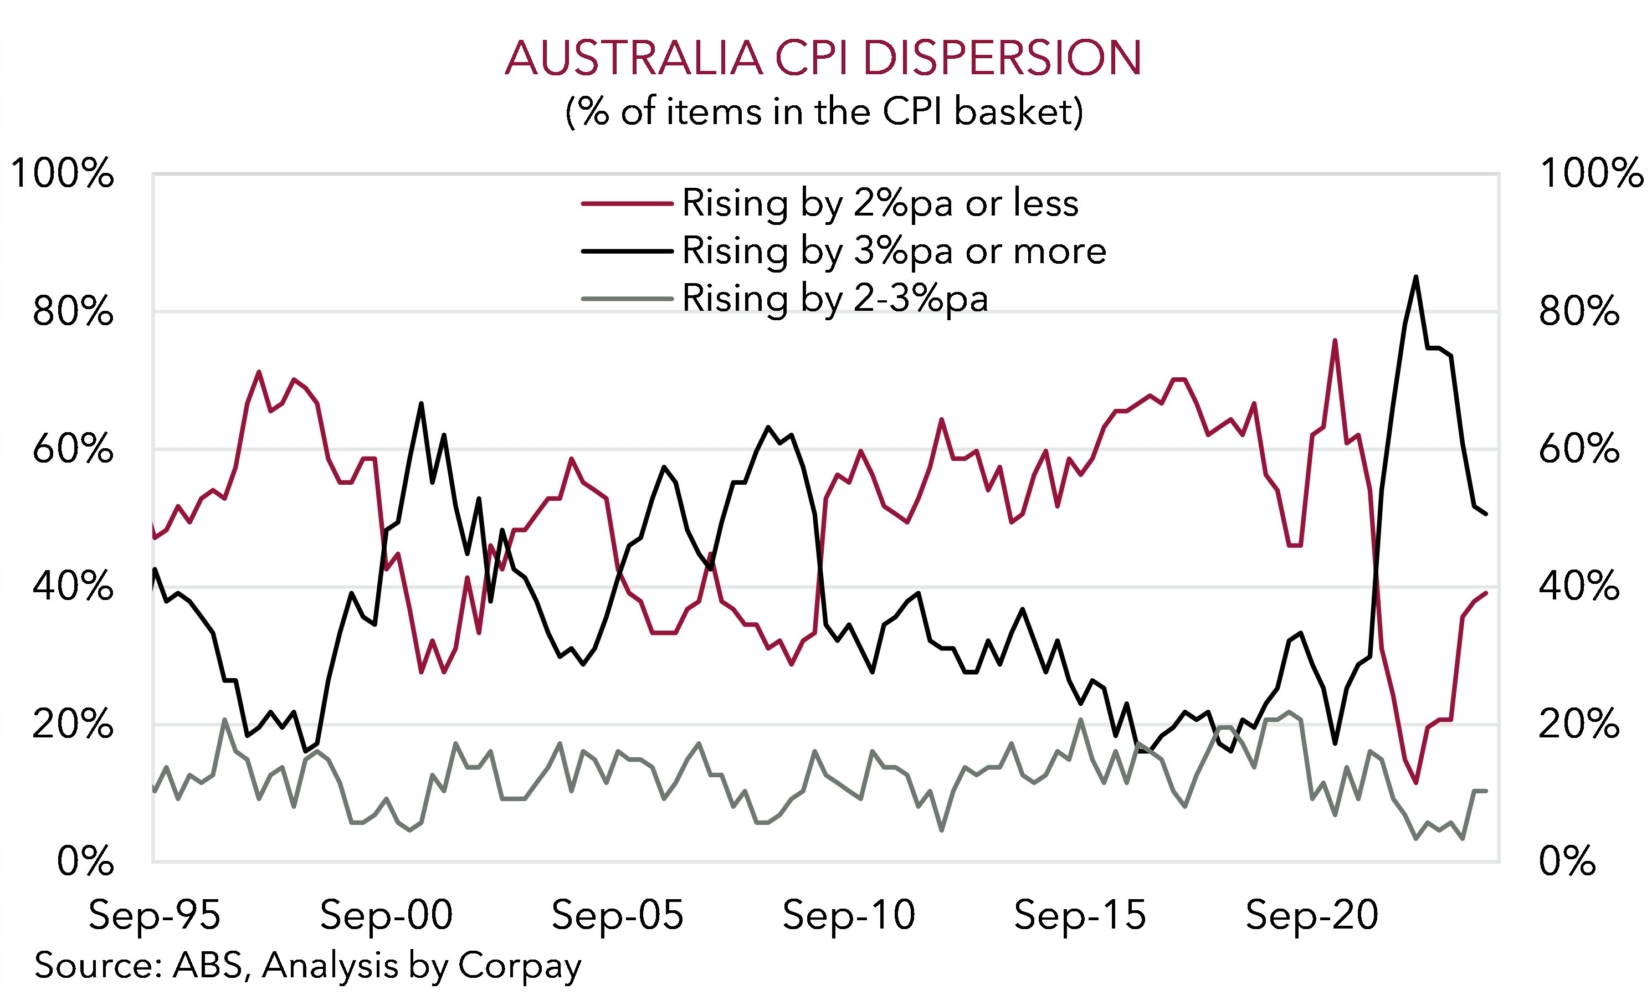
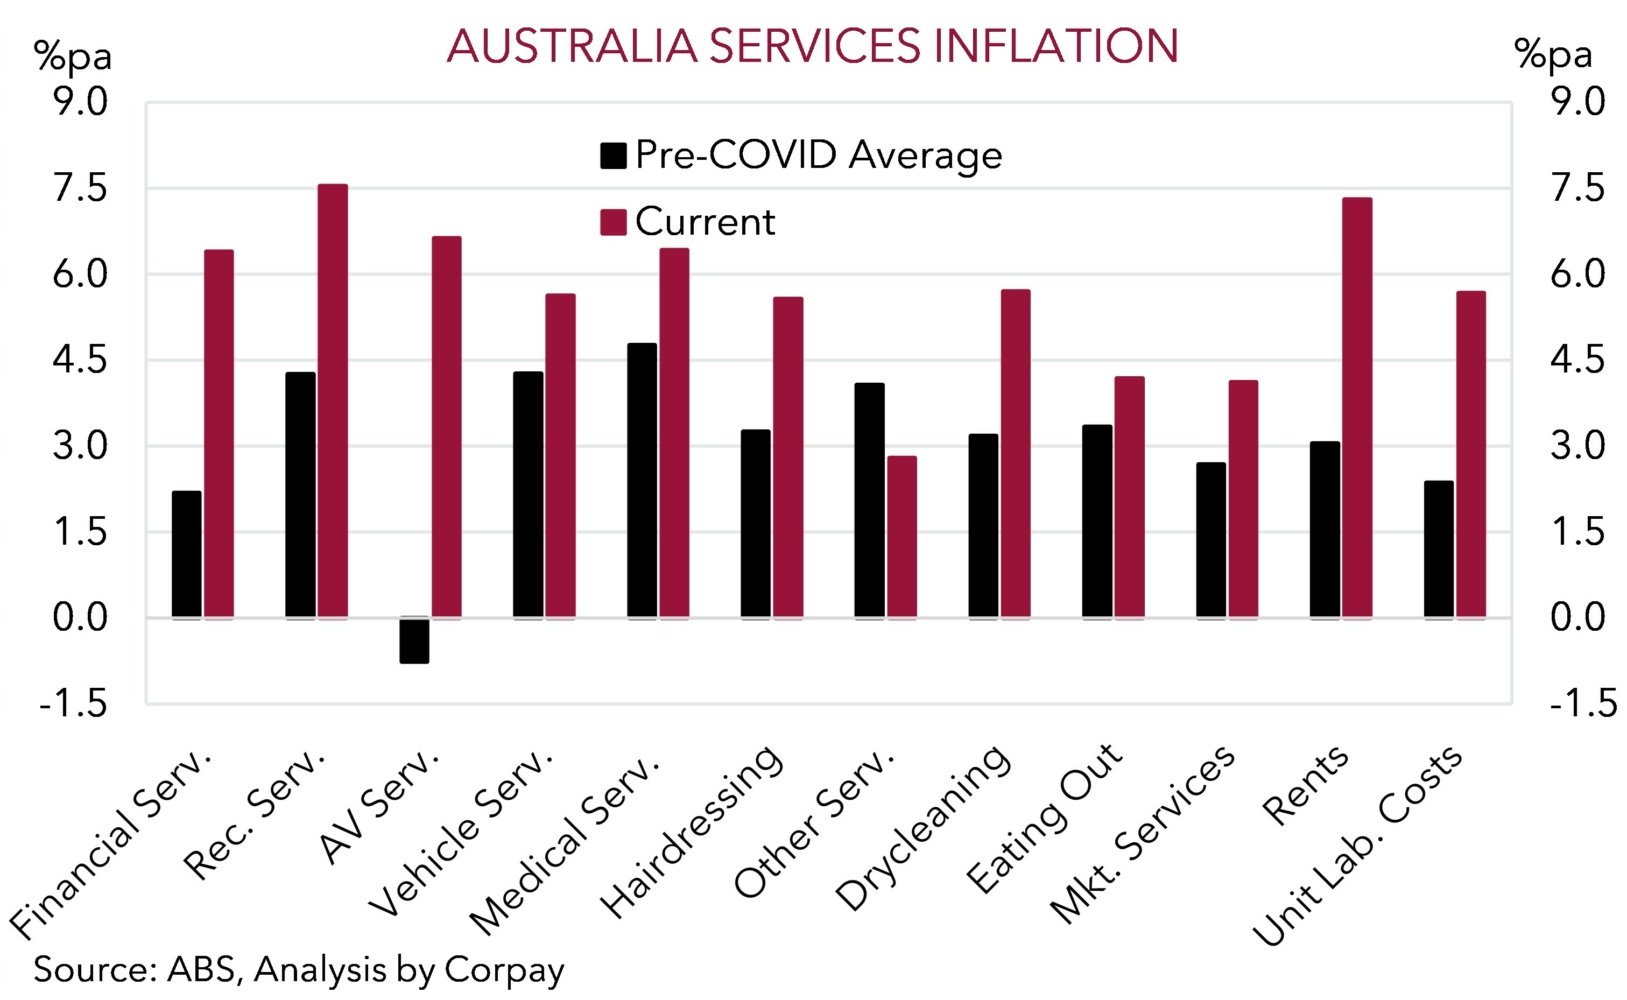
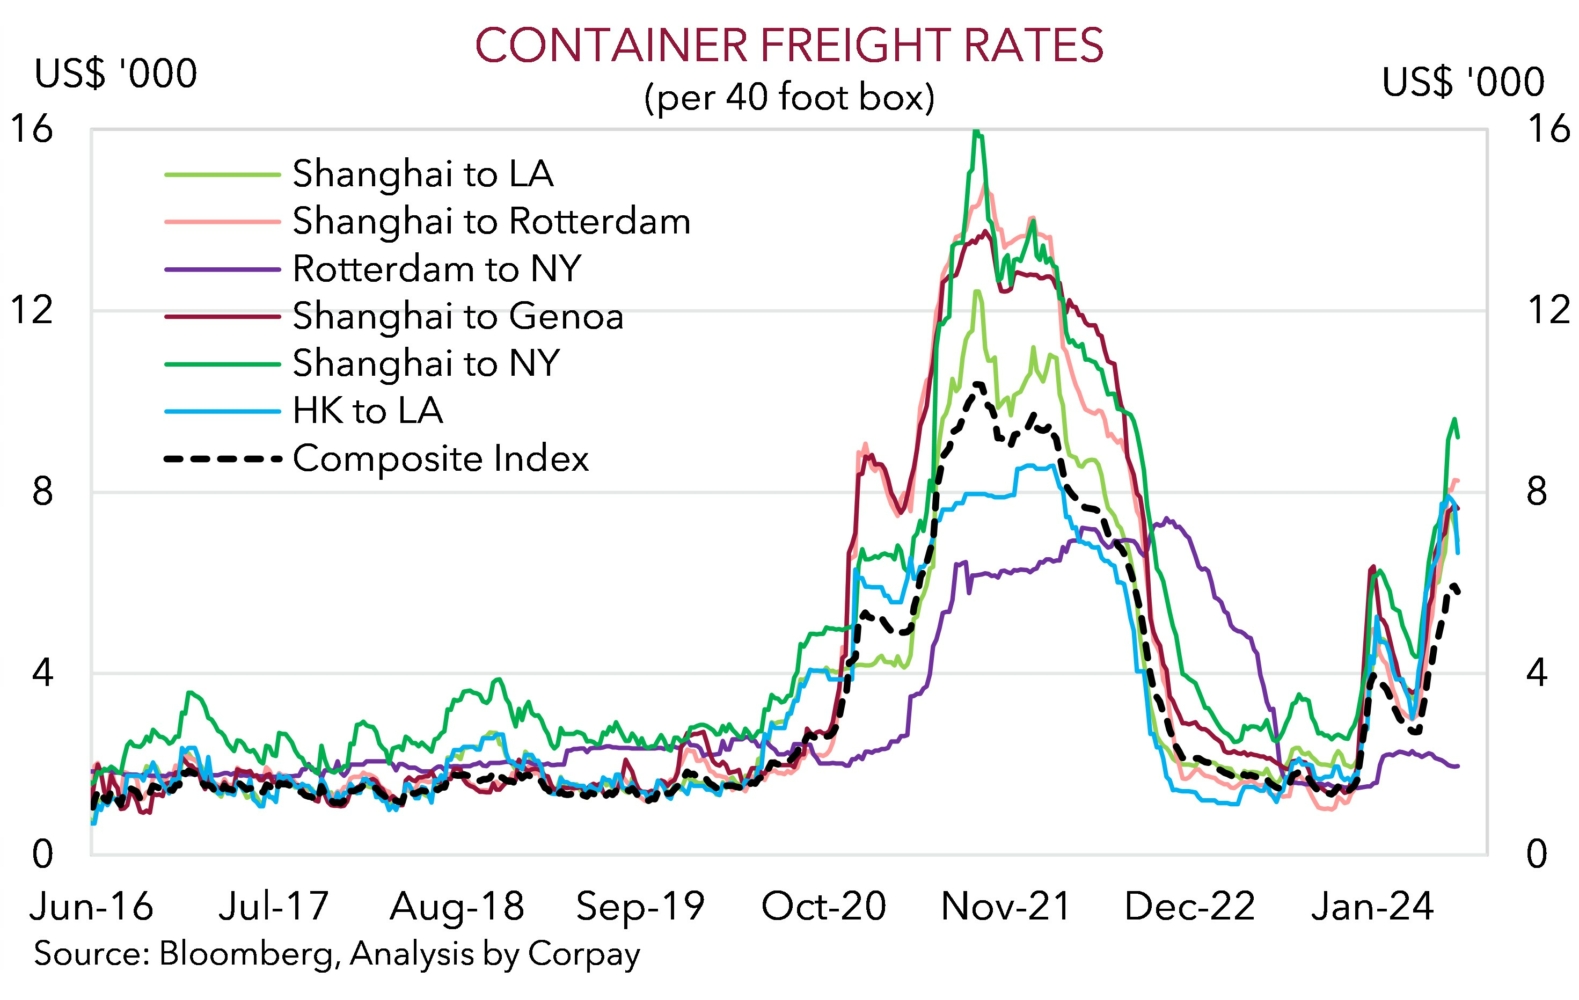
No doubt there has been improvement over the past year or so, but more is needed. Our dispersion measure shows a greater than average share of the basket continues to rise by 3%pa or more (chart 4). Sticky services and non-tradeables (i.e. domestic) inflation, which are tethered to local economic conditions and things like wages/rents continue to track north of levels consistent with the RBA’s target. As our chart illustrates, because of elevated unit labour costs and Australia’s lackluster productivity, various services inflation sub-components are above pre-COVID averages (chart 5). At the same time, the disinflation in ‘goods’ prices might be facing renewed challenges. Global freight costs have jumped up over recent months as vessels are re-routed to mitigate Middle East risks (chart 6). Locally, income support is also flowing with the stage 3 tax cuts kicking off on 1 July. This, combined with the larger population, may prop up demand.
Bottom line, while the Q2 inflation result appears to have extinguished RBA rate rise prospects, we believe our long-held thesis that the RBA is set to lag its global counterparts in terms of when it starts and how far it goes during the next easing cycle remains intact. We think the first RBA rate cut is a story for Q1 2025, at the earliest. As such, over time, relative yield differentials should progressively turn more in Australia’s favour as the RBA holds steady and other central banks like the ECB, Bank of England, and US Fed lower interest rates further or start the process.
In our view, this should help the beleaguered AUD, which has been weighed down recently by wobbles in risk sentiment to the point it is now ~1.5-2 cents under our modelled ‘fair value’ estimate, recoup lost ground (chart 7). Moreover, statistically the AUD is back in a region we deem ‘rarefied air’. Australia is running a broad basic balance of payments surplus with the terms of trade also above average. Since these positive AUD flow and valuation dynamics swung into gear in 2015 the AUD has only traded sub $0.65 in ~6% of trading days with the bulk of this small pool occurring during acute bouts of market stress such as the start of COVID (chart 8).