Last week’s ‘reciprocal tariff’ announcements by the US, and subsequent retaliation last Friday by China, has caused a fair degree of market upheaval. Given the broad-based and outsized tariffs imposed on goods shipped to the US, concerns about downside growth and upside inflation risks have spiked, and this has triggered an abrupt repricing in ‘complacent’ asset markets (chart 1). Equities and commodities have tumbled sharply over the past few sessions, as have growth-linked currencies such as the NZD and particularly the AUD which has plunged to levels last traded in the early dark days of COVID (now ~$0.6030).
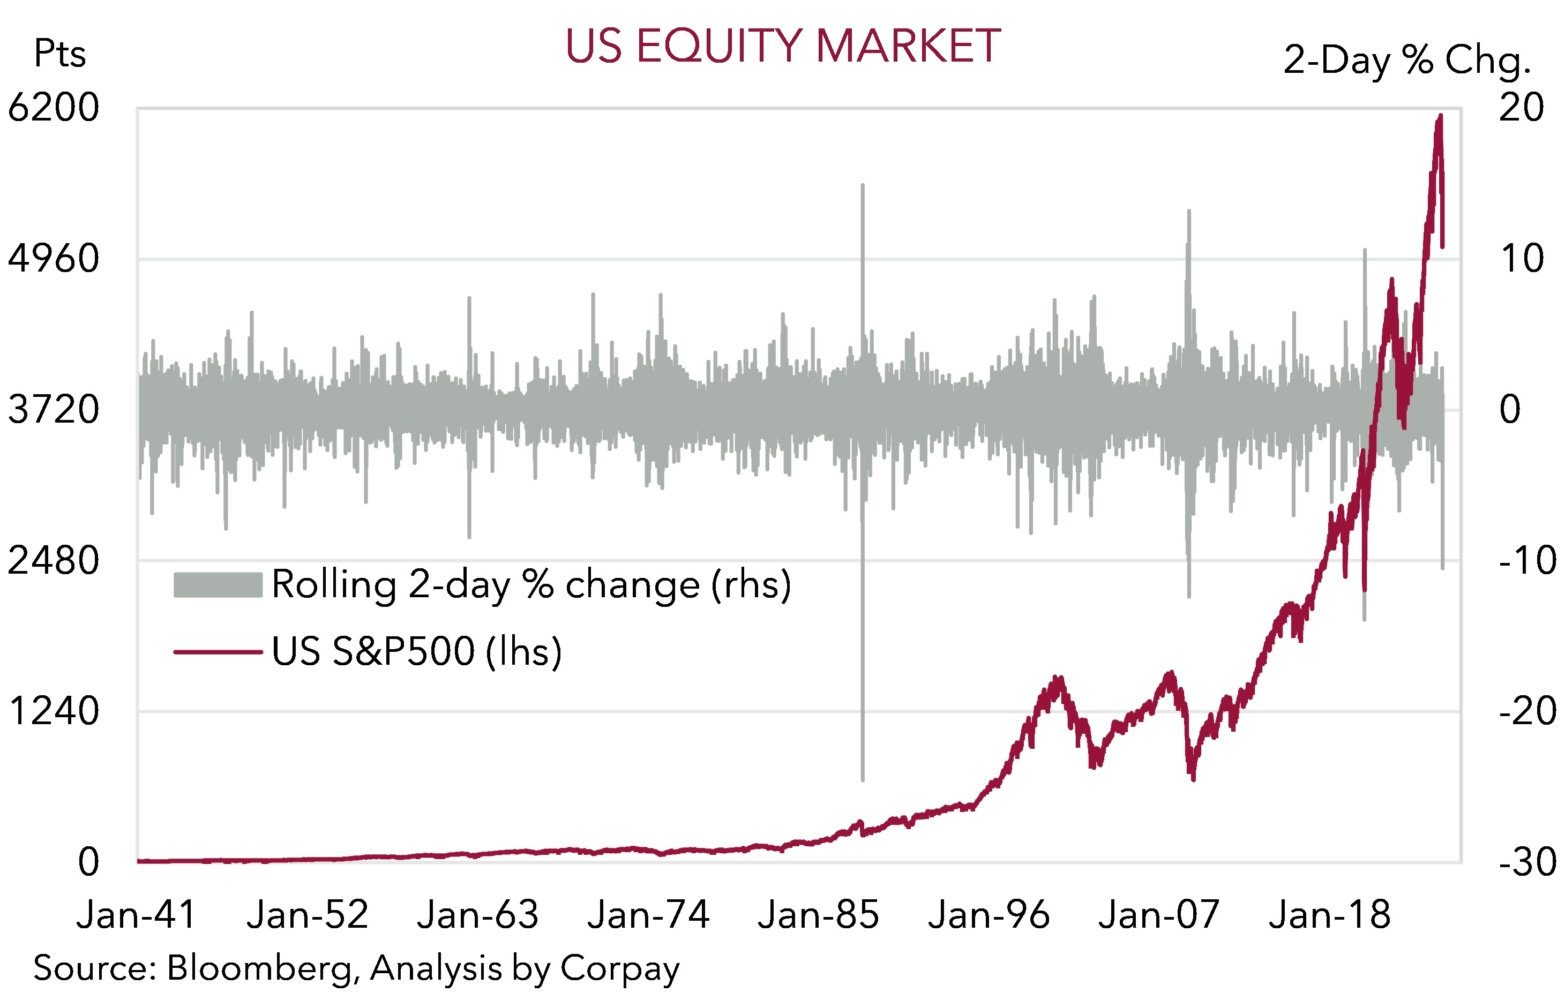
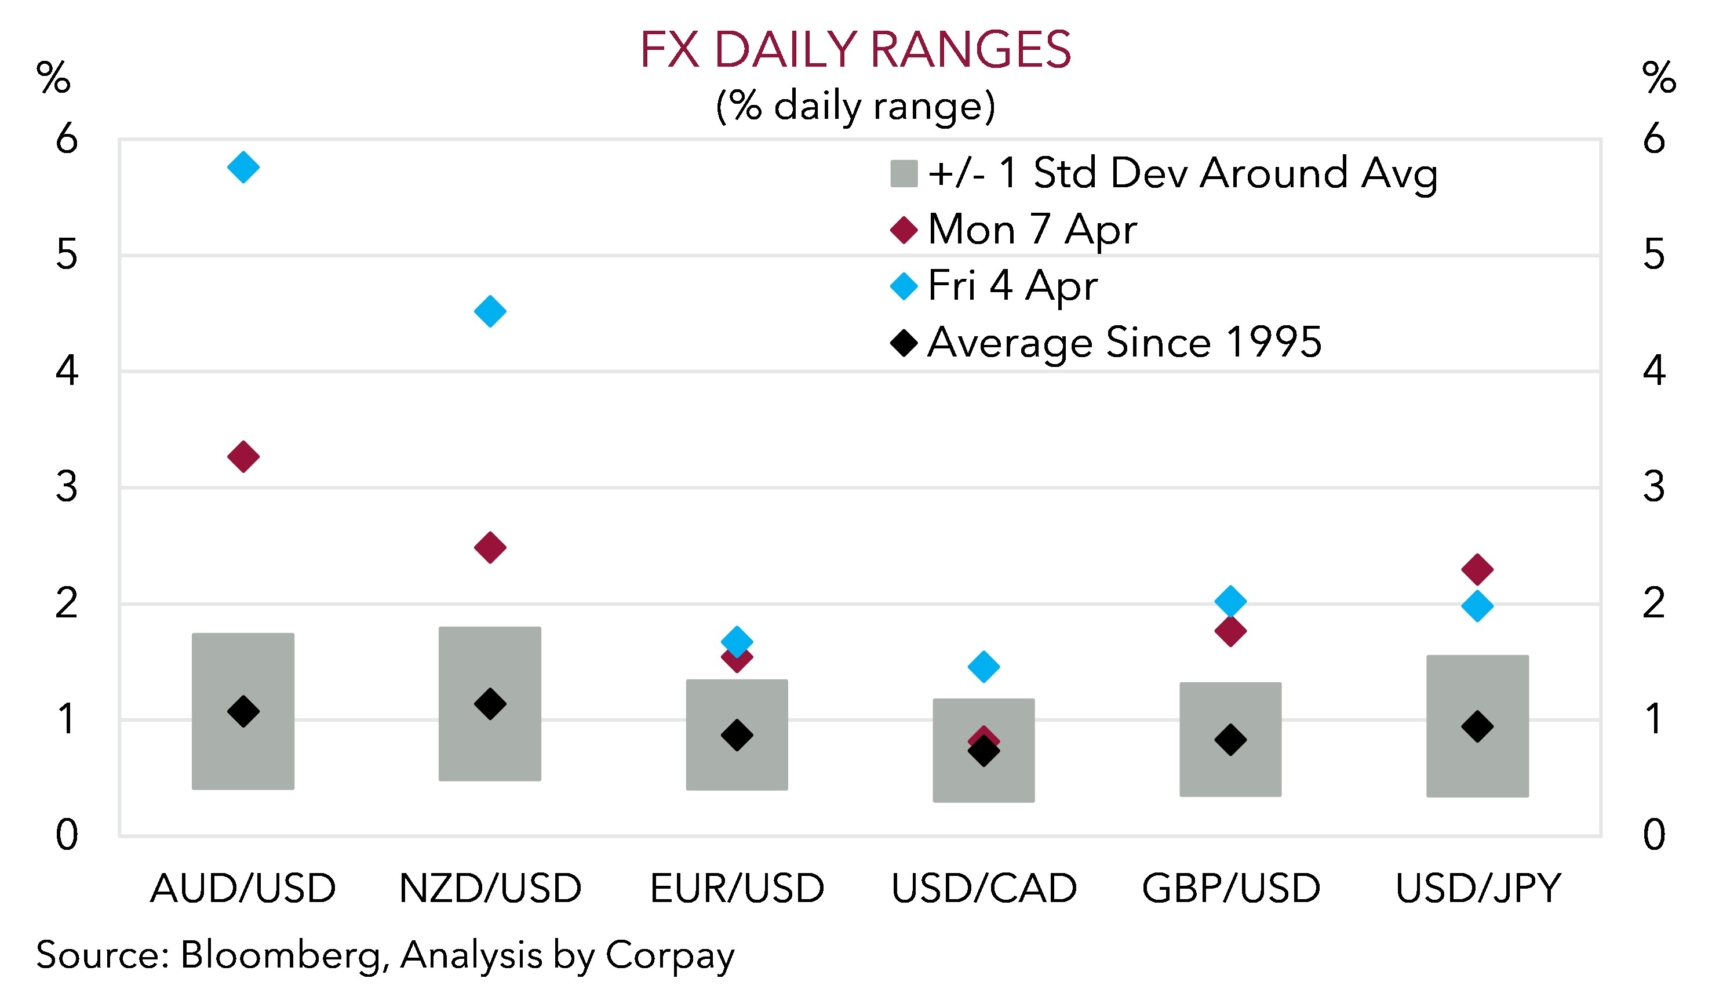
In our view, the direction of travel of the market ‘risk off’ reaction is right, but the degree to which some assets have moved looks excessive. The AUD is a case in point (see below) as the “shoot first, ask questions later” market mindset has seen participants quickly factor in something far more sinister than a stepdown in US/global economic activity. Indeed, looking at some of the market action we would highlight a few of the extreme swings: (a) the more than 10% drop in the US S&P500 over last Thursday/Friday is one of the chunkiest two-day declines in 85 years. These types of steep falls have only occurred previously during the 1987 stock market crash, the GFC, and onset of COVID (chart 2); (b) the VIX equity volatility index has spiked to ~47, its highest closing level since 2020, and before that when the Eurozone sovereign debt crisis intensified in 2011. Again, this is something that hasn’t occurred frequently, even less so outside of a full-blown dislocation; (c) Hong Kong’s Hang Seng Index endured its largest one-day drop (-13.2%) since 1997 on Monday; (d) last week’s 14% slump in copper (which put prices back to where they were in January) has only been exceeded a small handful of times; and (e) Friday’s slide in the AUD, in percentage terms, was the biggest one-day decline since the GFC with the daily trading range over 7 standard deviations larger than normal (chart 3). On our estimates, the AUD’s daily range has only been wider 14 times since 1989.
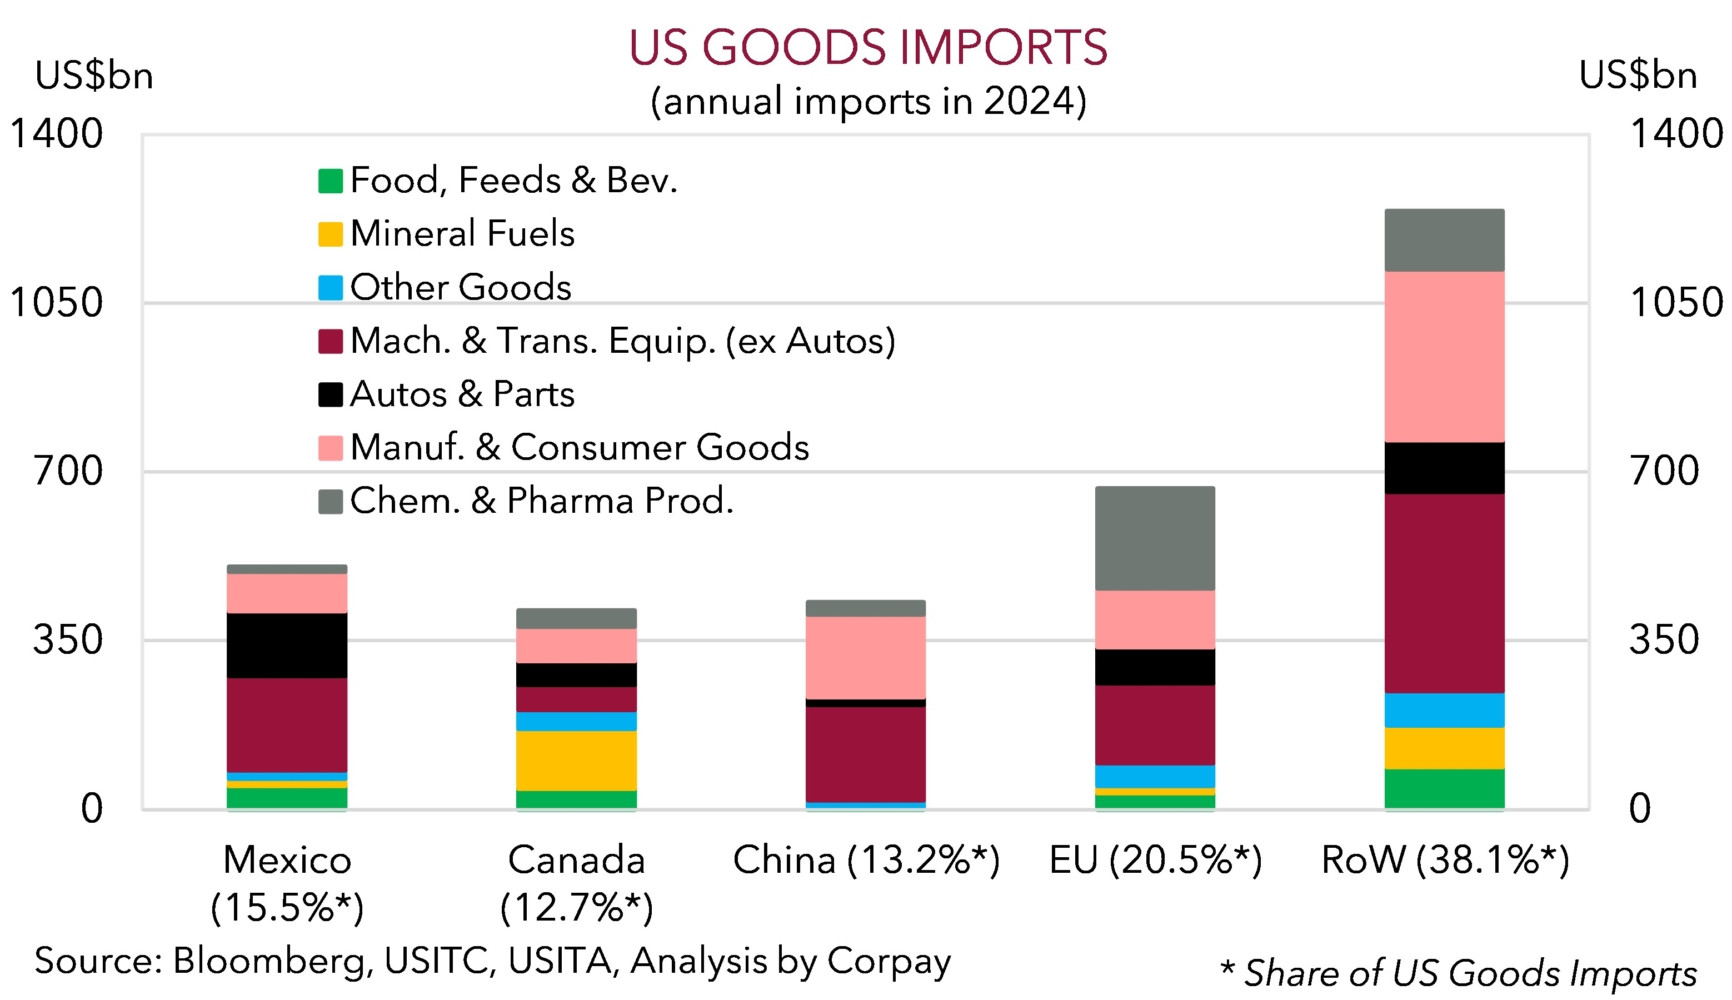
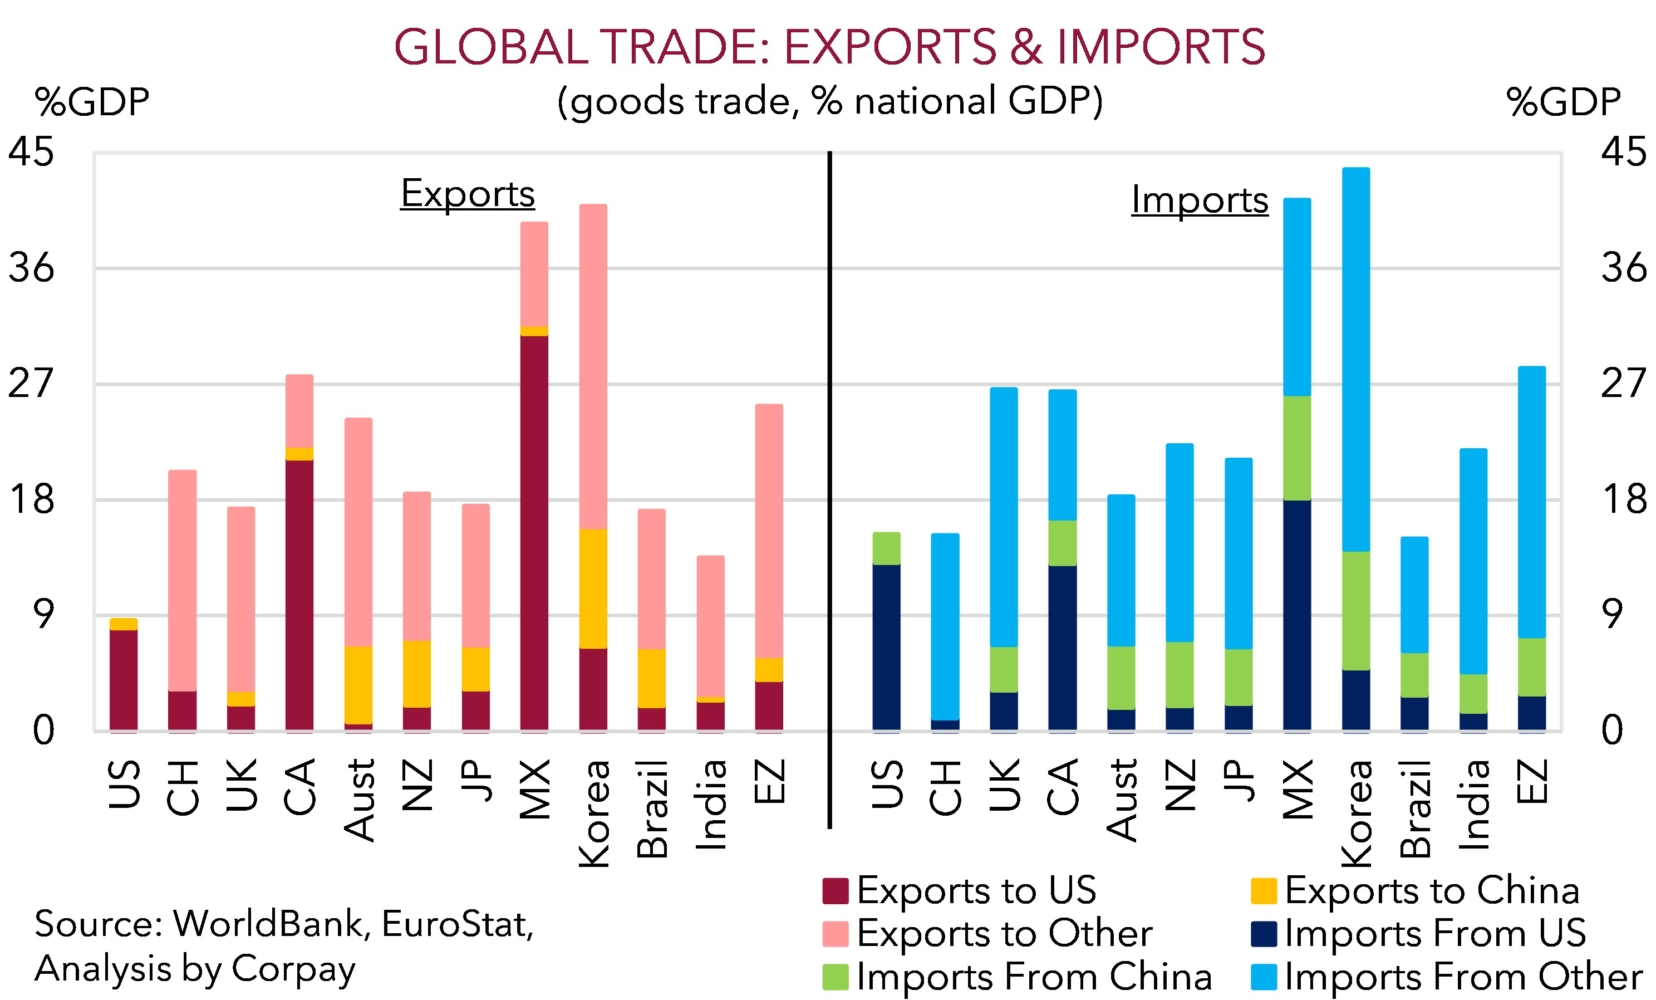
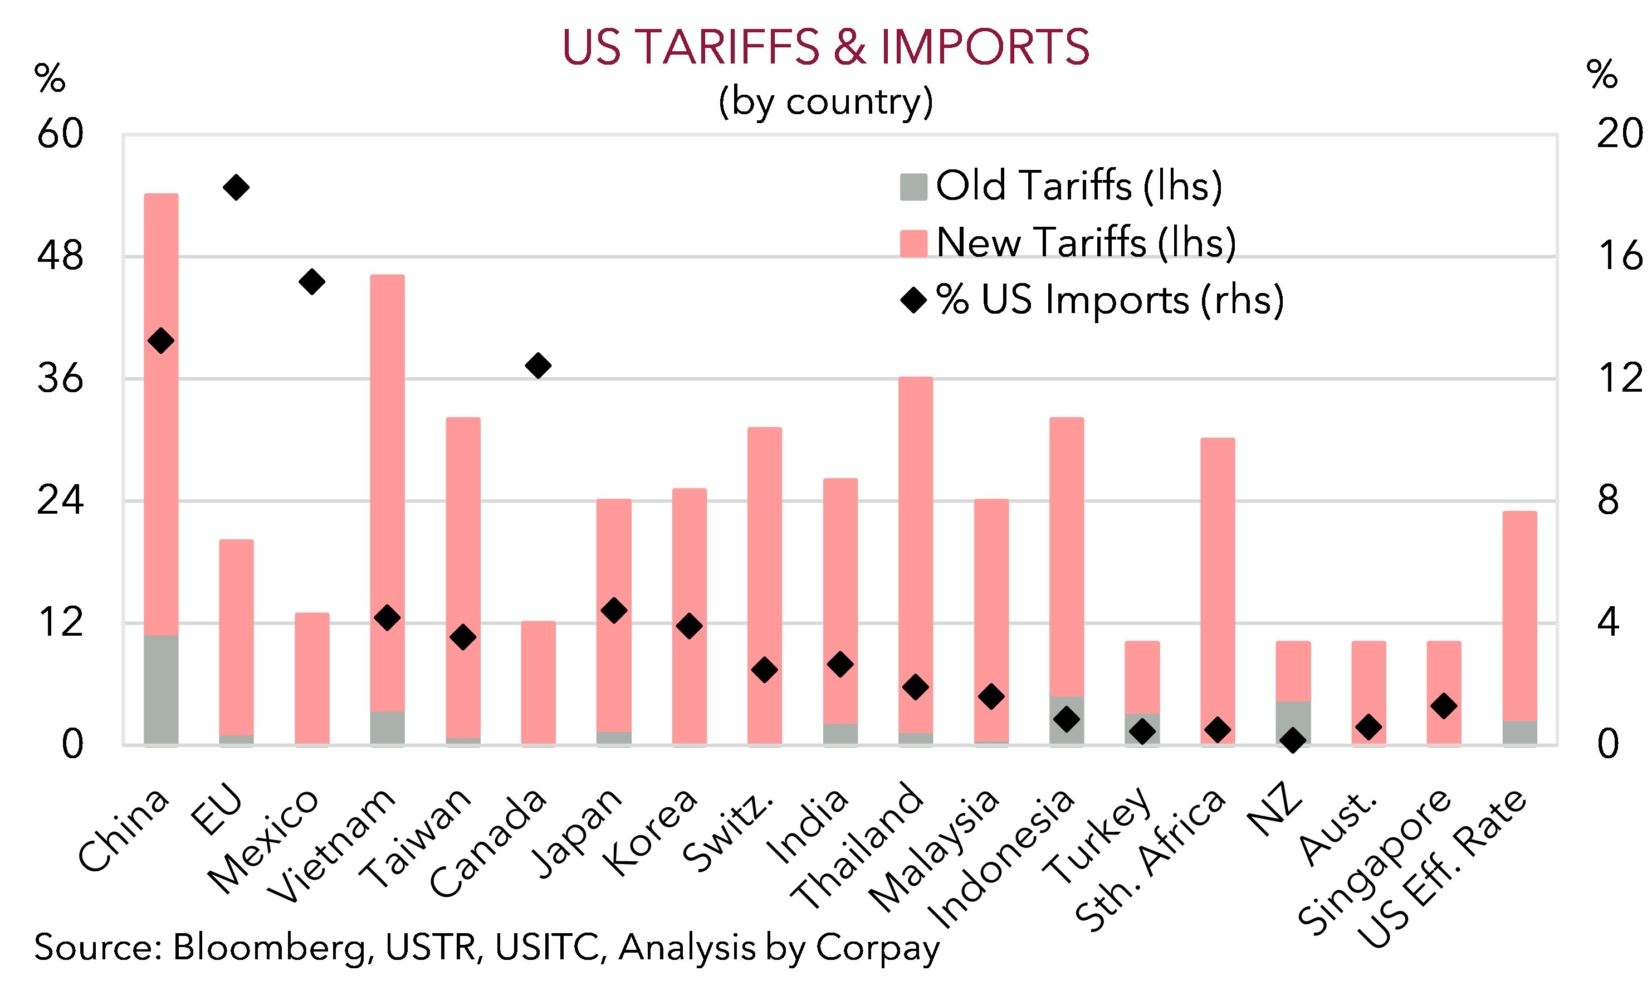
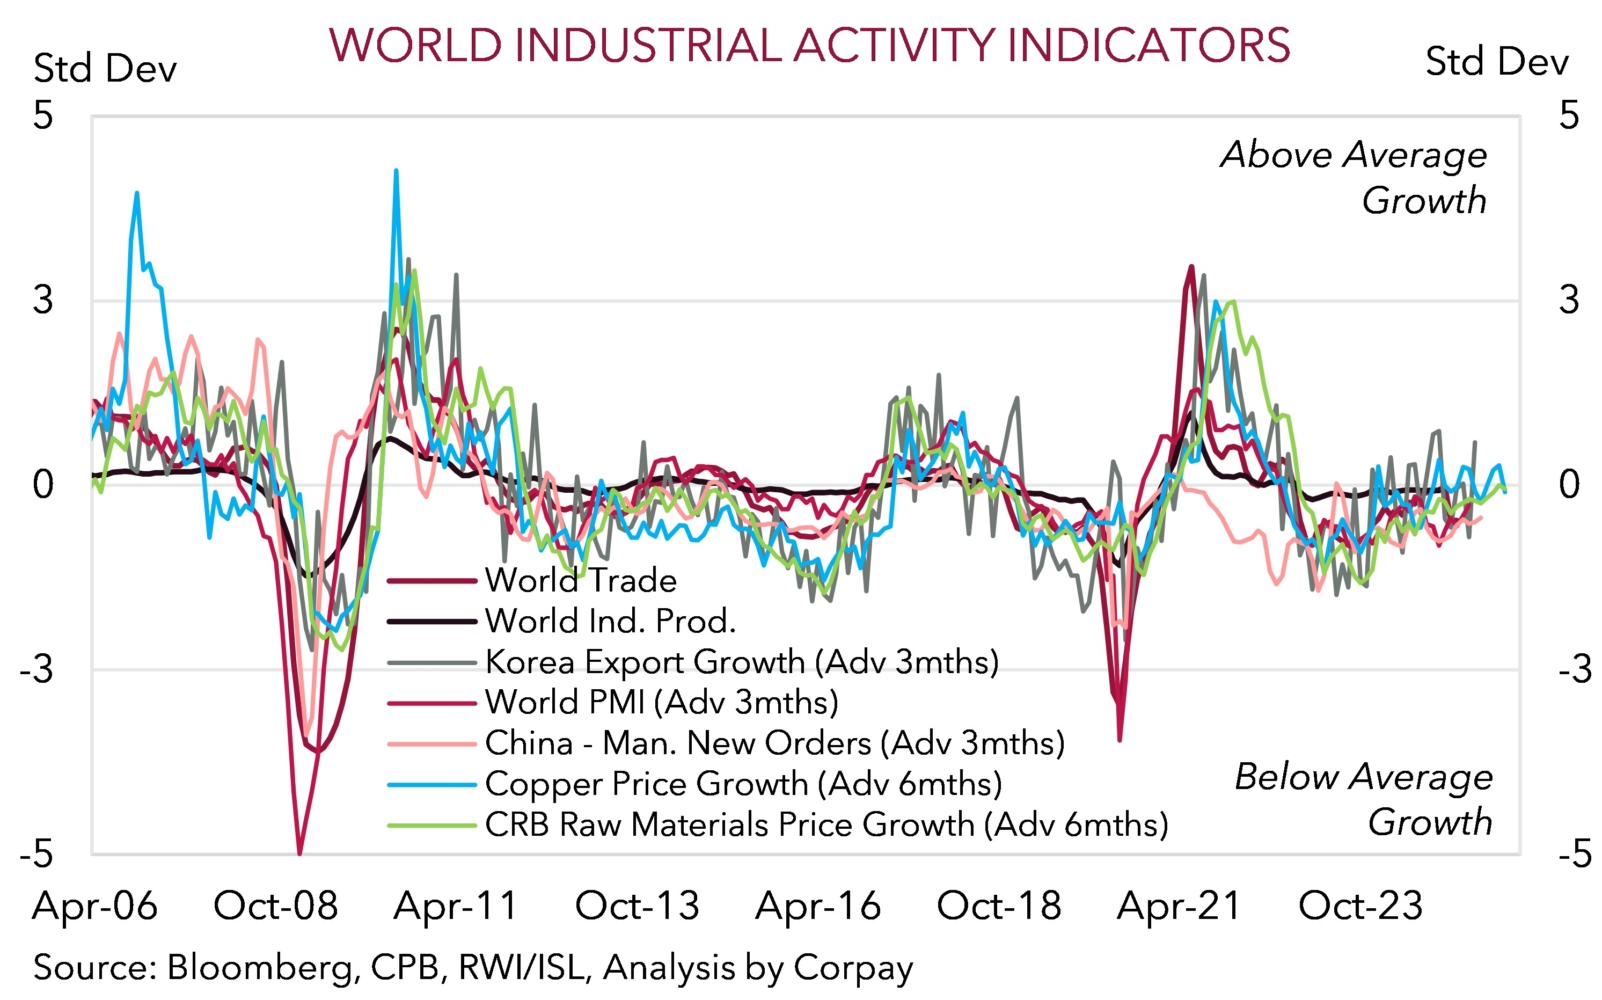
All these examples make for grim reading. No doubt there will be real world economic consequences. But the reality often isn’t as bad as feared. This is likely to be another example. An economically significant share of US imports will be captured by the higher ‘reciprocal’ duties. These levies, and higher prices, should act as sand in the gears of US consumption and business investment given the array of goods captured, with subpar confidence, heightened uncertainty, and lower volumes likely to translate to a weaker US labour market down the track, in our view (chart 4). Given it is the largest economy in the world weaker demand in the US should mean global production and trade also slows (chart 5). However, higher odds of a slowdown and ‘Trumpcession’ needn’t equate to elevated chances of a crisis. A lot of the amplifiers, particularly in the US, that have previously made a bad situation worse such as high household debt and inadequate buffers/circuit breakers don’t look to be there, in our opinion. We would also note that this is also the signal coming through in more measured credit markets. US credit spreads, which have historically proven to provide a truer reflection of underlying economic risks, have widened due to growth worries, but they are flashing a light shade of ‘amber’ rather than ‘red’ (chart 6).
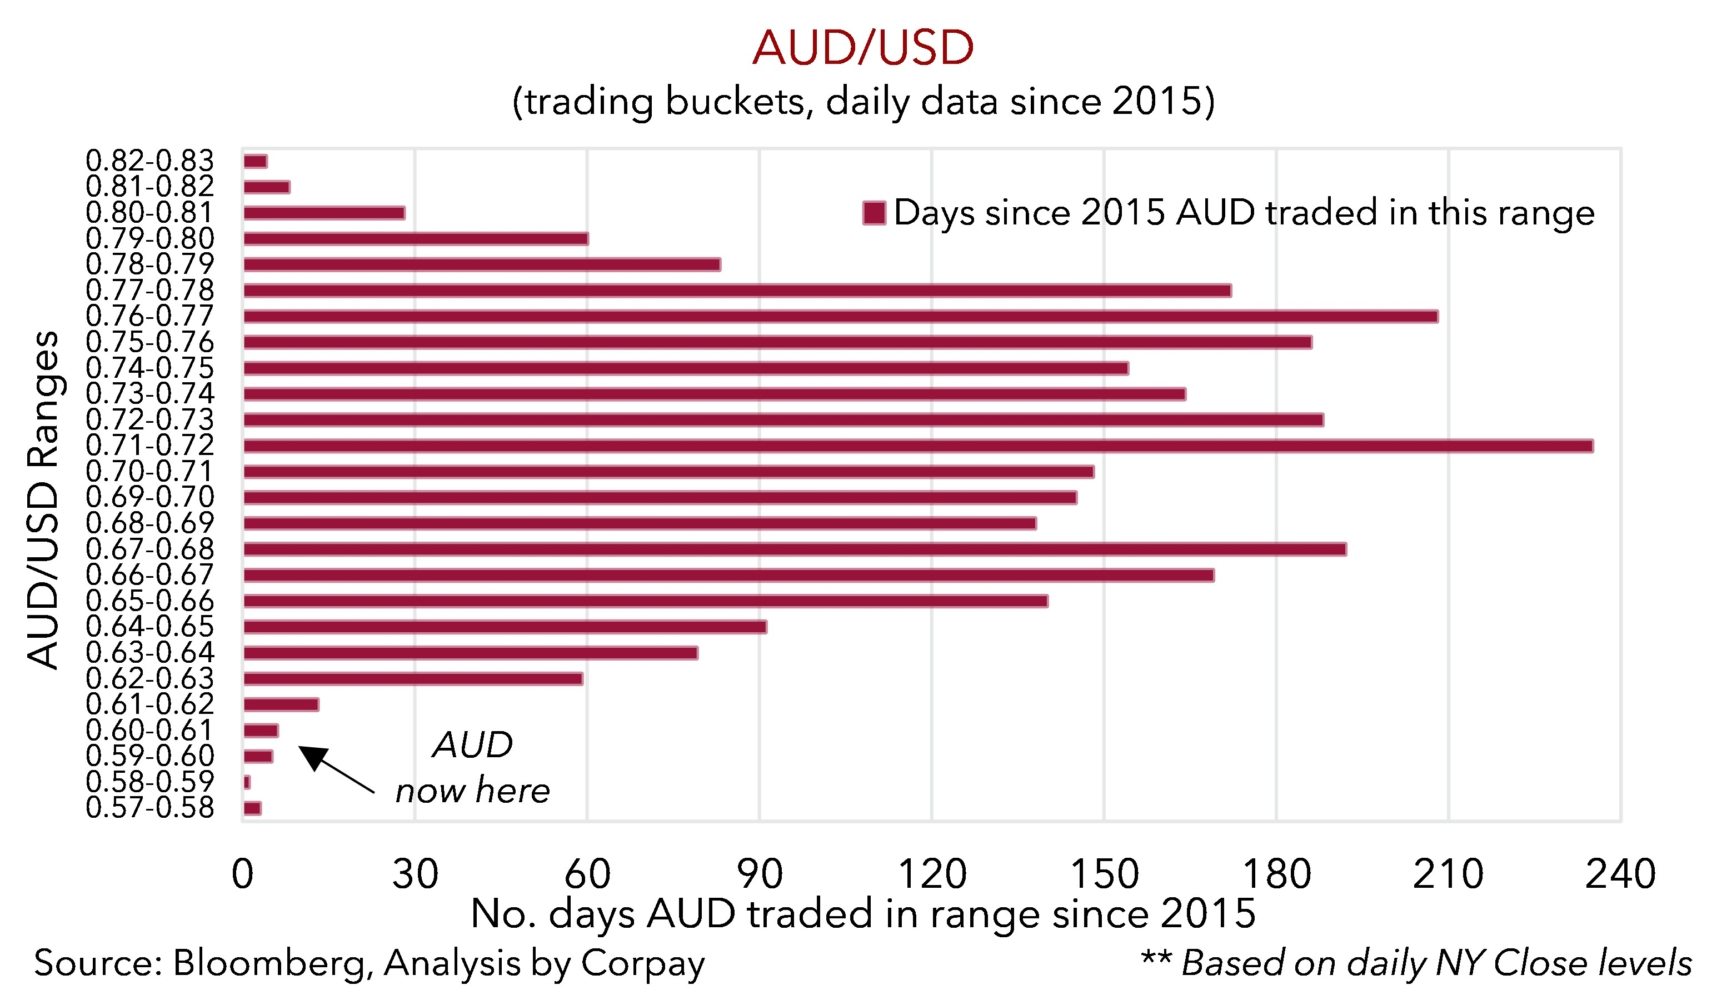
Sentiment and momentum have been overpowering fundamentals. This can persist for a while longer and points to heightened volatility continuing near-term. However, as more rational thinking returns to the fore and ‘crisis’ concerns recede we would expect the USD to give back ground and the unduly beaten up AUD to rebound. As discussed before Australia’s direct trade exposure with the US is minimal (only ~4% of exports are sent to the US). Added to that, as per during President Trump’s first term, authorities in China are wading in to counteract trade headwinds by stimulating domestic activity. This is where Australia’s key exports are plugged into, and media reports yesterday stating officials in China are discussing “front-loading” measures shows the intent is there (chart 7). Another growth offset is in Europe where officials have pivoted towards increased fiscal spending as the region looks to boost defence capabilities and infrastructure. Markets are driven by outcomes compared to expectations, and if often appears darkest before the dawn. In our judgement a lot, if not too many, negativities now look baked into the AUD. We believe there are uneven risks around the AUD near current levels (i.e. there is more upside than downside potential) given the low starting point (the AUD has only closed below ~$0.60 in 8 trading days since 2015) and valuation support (the AUD is ~5-6% below the average of our suite of ‘fair value’ models even after capturing recent market moves) (chart 8).