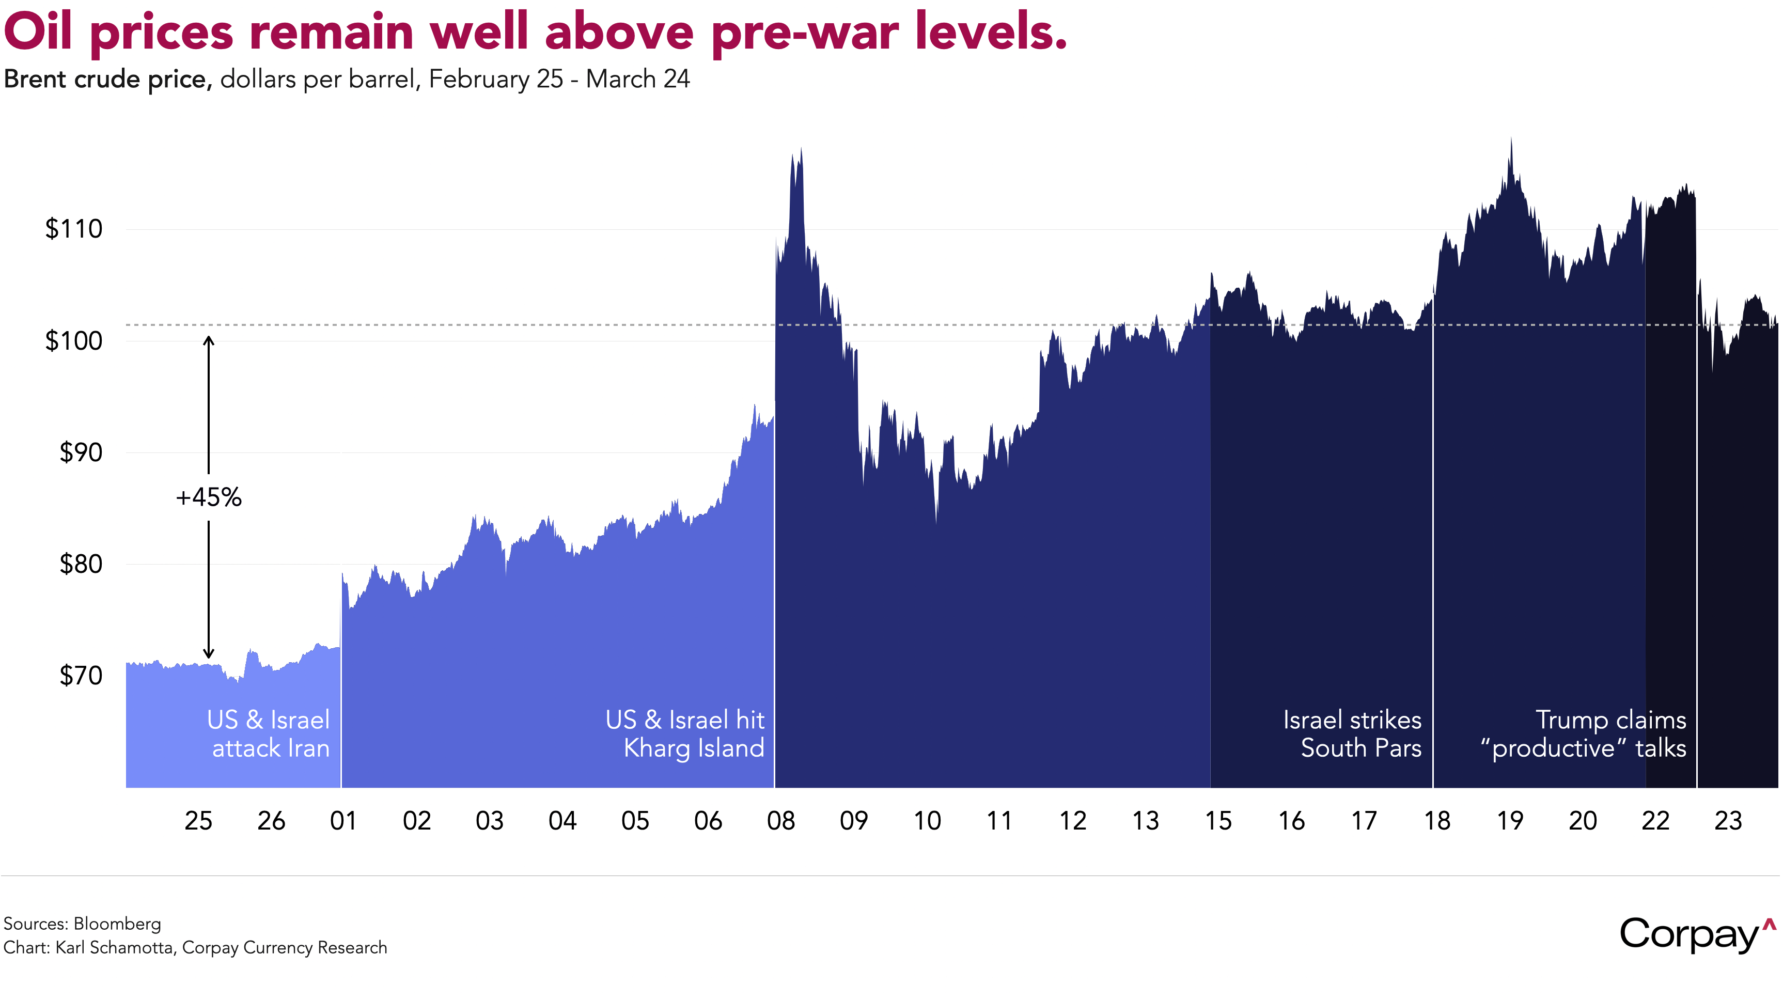
Energy prices are ratcheting higher once again as fighting in the Middle East rages unabated, suggesting that President Donald Trump’s efforts to find a diplomatic off-ramp have not met with success thus far. Brent crude is trading above $100 a barrel, West Texas Intermediate is clinging to the $90 threshold, and European gas benchmarks are climbing, reversing yesterday’s retreat* which came after the president claimed “productive discussions” were underway to end the conflict—only to be contradicted by Iranian officials later in the day**. This morning, Treasury yields are little changed, equity futures are pointing to modest gains at the North American open, and the dollar is inching higher amid a slow-motion flight to safety. The Canadian dollar is back to levels that prevailed ahead of yesterday’s surge in optimism.
The euro is trading with a defensive bias after private sector activity fell to a ten-month low, suggesting that hopes for a stimulus-led rebound are fading as businesses grapple with a rapidly-unfolding energy shock. According to Chris Williamson, an economist at S&P Global, the firm’s composite purchasing manager index fell to 50.5 points in March after business costs climbed at the “fastest rate for over three years amid the surge in energy prices and choking of supply chains resulting from the war in the Middle East”.
Across the Channel, the pound is performing even worse as traders downgrade growth expectations after business activity slowed and inflation pressures surged in March. S&P Global’s composite purchasing manager index dropped to a six-month low of 51.0—barely above the threshold separating expansion from contraction—while manufacturing input costs surged at the fastest monthly pace since Black Wednesday in 1992.
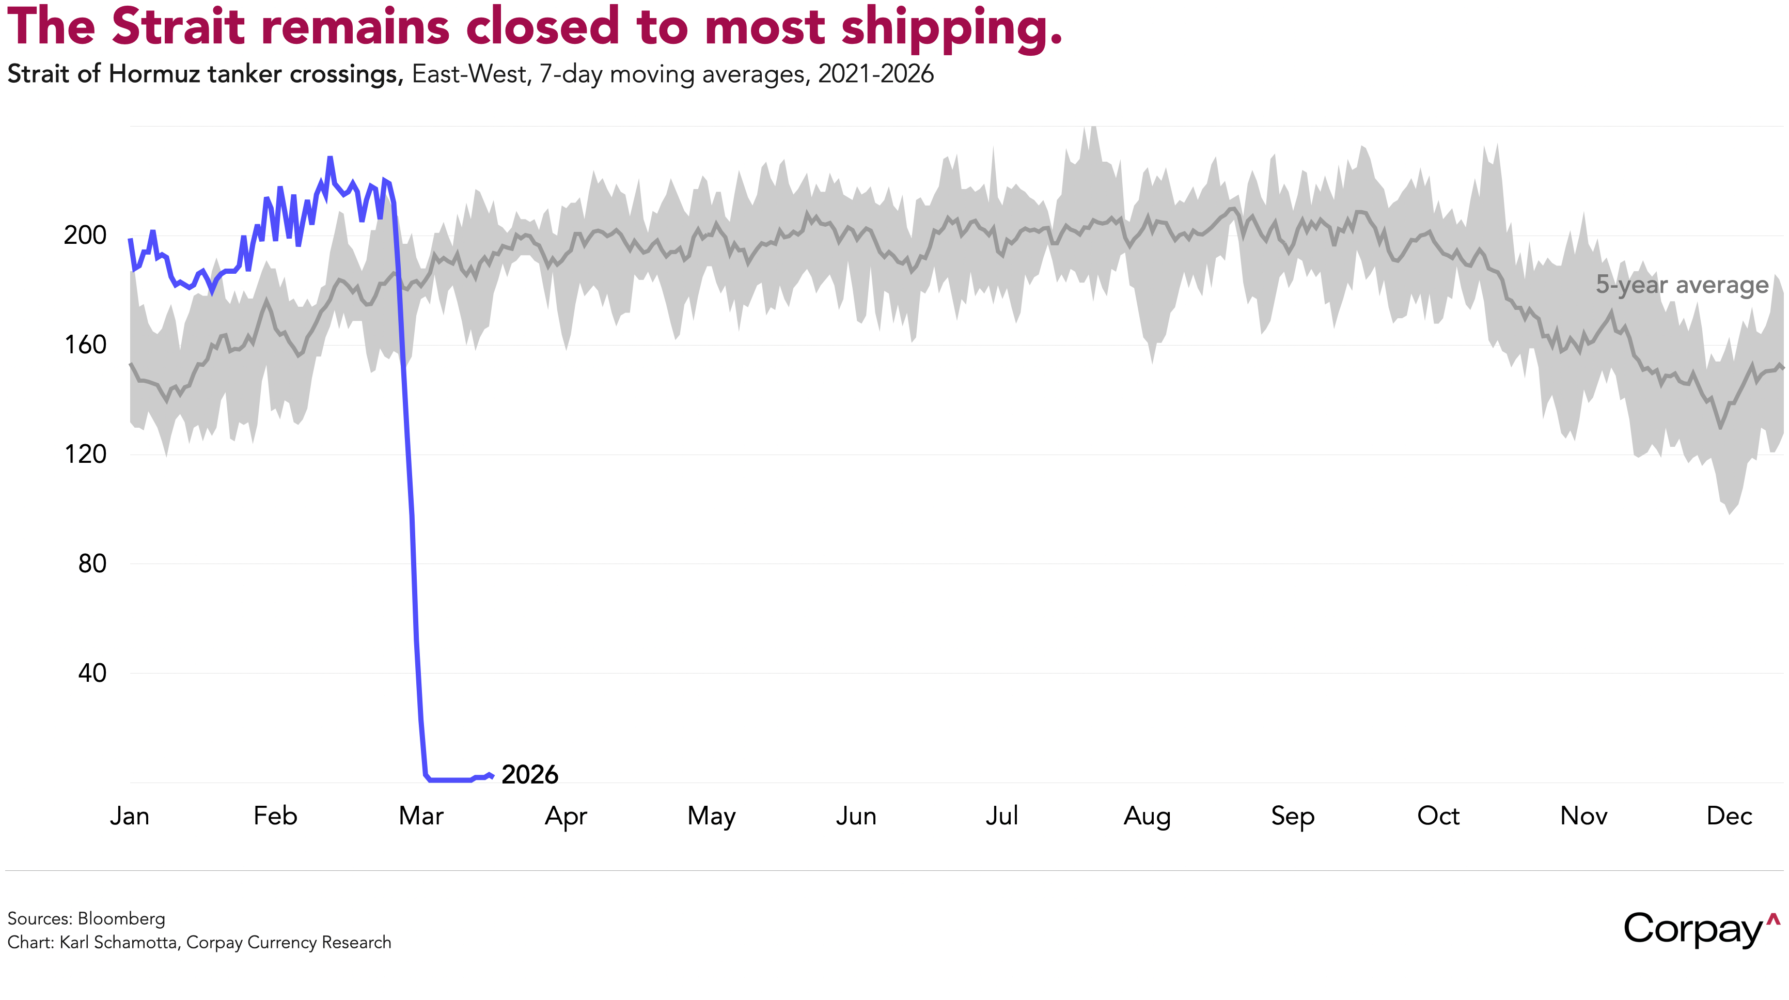
Similar dynamics are likely to appear elsewhere. Inflation expectations have risen across the world economy as the conflict chokes crude flows through the Strait of Hormuz—the narrow passage through which roughly a fifth of the world’s seaborne oil transits—driving gasoline, freight, petrochemical feedstocks, and food prices higher. Although a handful of tankers have crossed the Strait in the past week, production and shipment volumes remain far below normal, taking several hundred million barrels of crude off global markets.
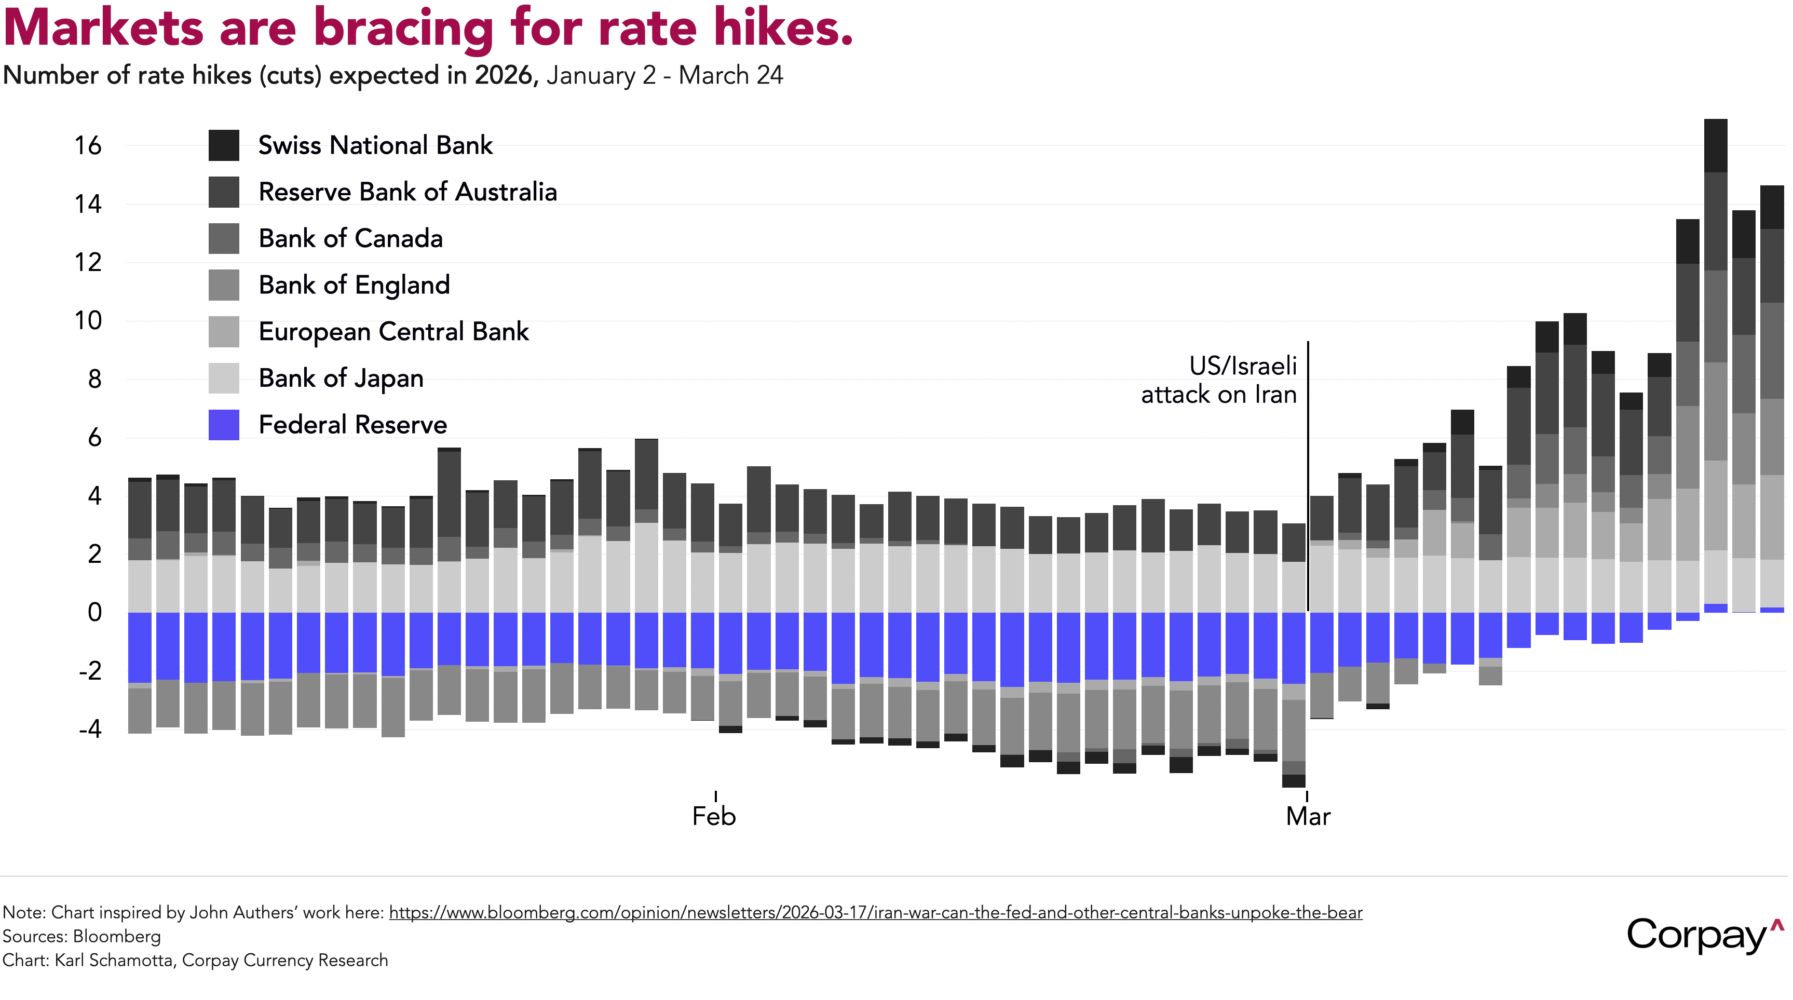
Markets have dramatically repriced the monetary policy outlook. After entering the year convinced the Federal Reserve would deliver at least two rate cuts before year-end, investors now see a hike as more likely—and are pricing tightening nearly everywhere else***. The Fed, European Central Bank, Bank of England and Bank of Japan all struck hawkish notes at their March meetings, with policymakers warning that soaring energy costs risk pushing headline inflation into dangerous territory.
Growth risks have received little attention thus far, but could take greater precedence in the coming weeks. Market and economic excesses today are far smaller than those that preceded the global financial crisis, yet financial conditions are tightening as trades predicated on lower rates unwind, sentiment is plunging alongside the hit to household budgets, and economic policy uncertainty is soaring, pointing to an eventual slowdown in consumer spending and business investment. We think this could force central bankers to move more gradually than is currently priced in, contributing to a narrowing in cross-currency rate spreads.
The implications for the dollar are paradoxical. In the near term, investors are unwinding cross-border positions and reallocating toward safe-haven assets, boosting the greenback against energy-sensitive rivals in Europe, Asia, and the emerging markets. But US growth is slowing, confidence in American institutions has taken yet another knock, and the country’s balance sheet is taking a turn for the worse. The Pentagon has reportedly asked for $200 billion to fund the war’s cost just as the impact of last year’s ‘One Big Beautiful Bill Act’ hits home, as potential tariff refunds exceed $130 billion, and as borrowing costs soar, widening fiscal deficits dramatically.
Bottom line: It may seem contrarian, given that ‘dollar smile’ dynamics clearly remain intact, but the longer-term bear case for the currency is becoming harder to dismiss.
*It is worth noting that this administration tends to deliver major shocks when North American markets are closed. Automated orders should be part of a hedger’s toolkit as long as that pattern holds.
**That investors don’t know which side to trust is rather remarkable.
***This method for showing global rate pricing was inspired by John Authers’ work here: https://www.bloomberg.com/opinion/newsletters/2026-03-17/iran-war-can-the-fed-and-other-central-banks-unpoke-the-bear