• Mixed signals. US data crosscurrents resulted in modest net market moves overnight. US equities consolidated. Oil prices fell. AUD lost a bit of ground.
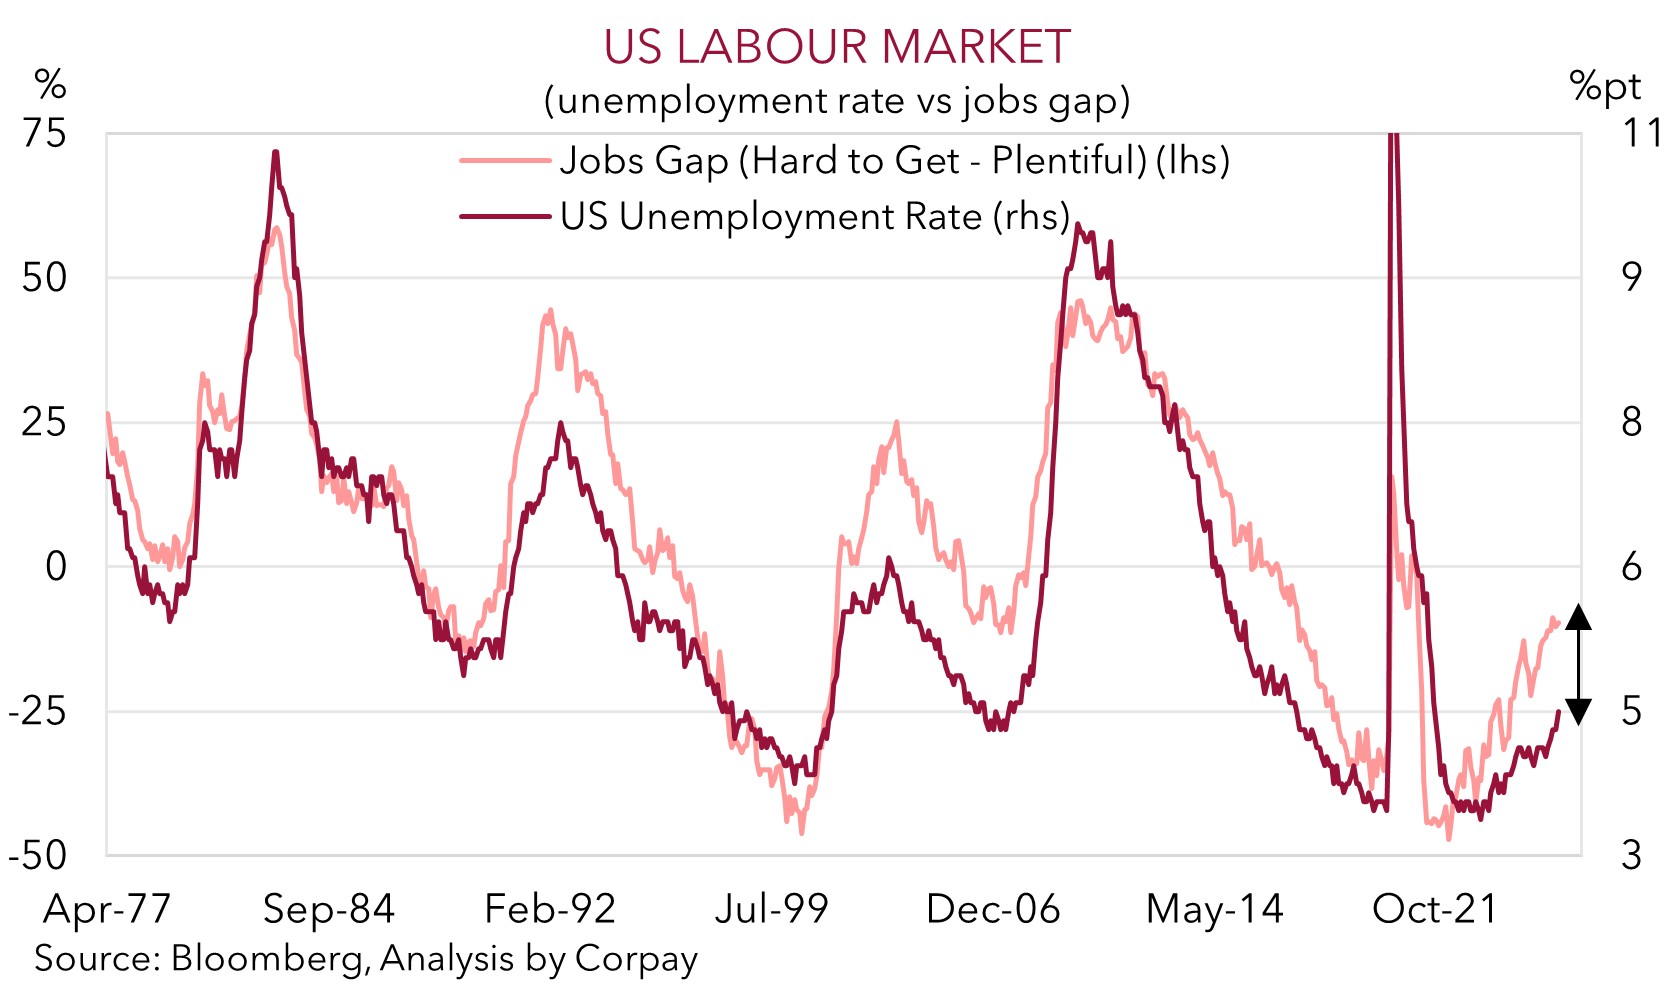
• US data. Core retail sales stronger, but PMIs underwhelmed. Labour market slack increasing with US unemployment highest since Q3 2021.
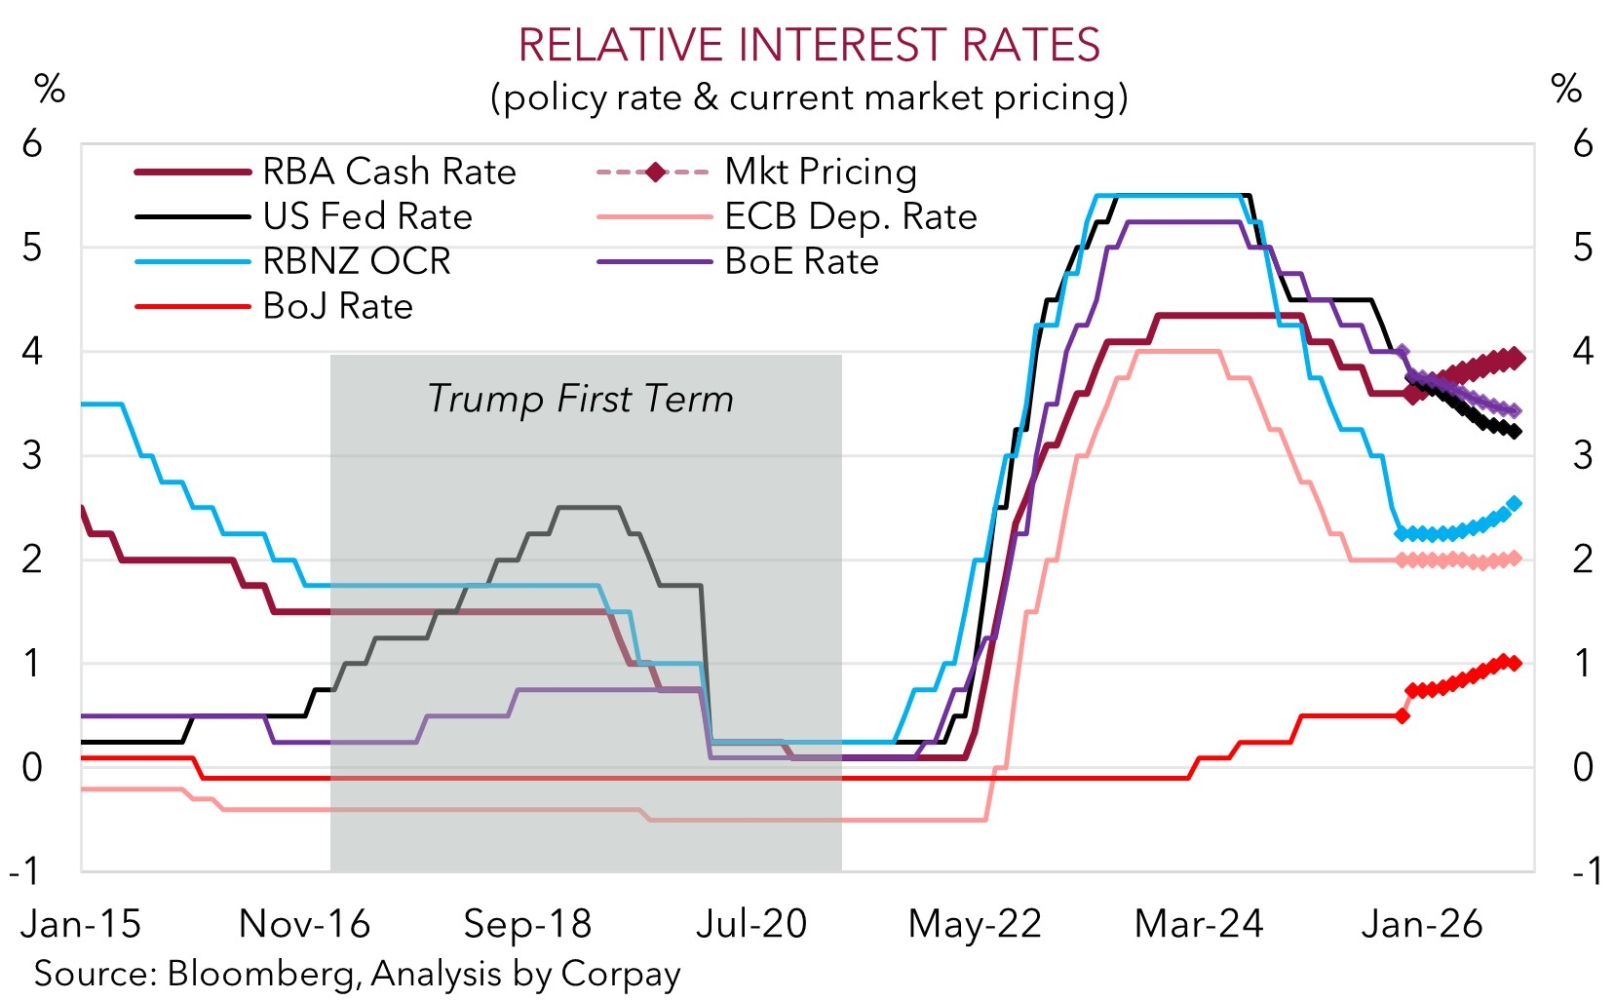
• Macro events. NZ Q3 GDP due tomorrow. US CPI and ECB/BoE/BoJ meetings later this week. BoE expected to cut while BoJ could hike rates again.
Global Trends
Push-pull forces stemming from the large batch of US economic data released overnight resulted in modest net market moves. On balance, although the tech-focused NASDAQ ticked higher (+0.2%) the broader S&P500 slipped back a fraction (-0.1%), as did US bond yields (~2-3bps lower across the curve). Elsewhere oil fell with WTI crude (-2.6%) around the bottom of the range occupied since early 2021 (now ~US$55.20/brl) due to signs of excess global supply. And in FX, the USD index softened slightly with a firmer GBP thanks to stronger UK PMIs (+0.4% to ~$1.3426) and some JPY strength (USD/JPY dipped to ~154.78) leading the way. EUR (now ~$1.1749) and NZD (now ~$0.5786) were range-bound, while AUD lost a bit of ground (now ~$0.6632).
In terms of the US data, consumption signals were mixed. Topline retail sales were flat in October, but that was a function of a drop in vehicle purchases due to the end of a government tax incentive on EVs. By contrast, the ‘control group’, which feeds directly into US GDP, rose a solid 0.8% (the most in 4-months) suggesting underlying consumer spending may have picked up steam during the early weeks of the holiday shopping season. The forward-looking US business PMIs showed a loss of momentum in manufacturing and services and the government shutdown disrupted labour market figures for October and November indicated ‘slack’ is increasing. Non-farm payrolls declined sharply in October (-105,000) as government workers accepted buyout offers, but there was a partial rebound in November (+64,000). That said, private jobs growth remains sluggish, wages decelerated (a sign labour demand is slowing more than labor supply), and the unemployment rate increased to 4.6% (a high since September 2021).
As our chart shows, leading indicators are pointing to a further rise in US unemployment over the months ahead as the impact of higher import costs/tariffs continues to bite down across the economy. This, combined with signs of contained inflation pressures (US CPI is out on Thursday night AEDT), may boost expectations for another US Fed rate cut in Q1 2026. Markets are only fully discounting the next US Fed reduction by mid-year. We believe this and risks of ‘hawkish’ vibes from the ECB (Thurs night AEDT) and/or BoJ (Friday) might exert downward pressure on the USD. We remain of the opinion that the US Fed could end up delivering more rate reductions than policymakers/markets now think. Over the medium-term, we expect the step down in US interest rates to weigh on the USD.
Trans-Tasman Zone
The US data crosscurrents buffeting markets overnight resulted in a range bound NZD over the past 24hrs (now ~$0.5786). By contrast, the AUD slipped back a little (now ~$0.6632) with weakness in oil prices (WTI crude -2.6%) and softer copper prices (-0.7%) exerting a bit of downward pressure and resulting in relative underperformance on the cross-rates. The AUD shed ~0.1-0.5% versus the JPY, GBP, NZD, CAD, and CNH.
There is no major Australian economic data released over the rest of the week. That said, in NZ, Q3 GDP is due tomorrow (Thurs 8:45am AEDT). Based on partial indicators a sizeable rebound in growth, after the large fall the previous quarter, is likely. On the back of the RBNZ’s aggressive interest rate cuts momentum looks to be turning the corner in several areas. NZ GDP could come in north of the RBNZ’s predictions (mkt ~0.8%qoq, RBNZ ~0.4%qoq). If realised, we think signs of an improving NZ economy could bolster the case that the RBNZ’s easing cycle has ended and the next move will be up not down, albeit in H2 2026 according to interest rate markets. This may give the NZD a boost and may see AUD/NZD lose altitude, in our view.
With respect to the AUD external forces should be in the drivers seat short-term with US CPI (Thursday night AEDT) and a few central bank meetings (ECB & BoE on Thursday night AEDT, BoJ on Friday) on the radar. On balance, we feel there is a risk US inflation underwhelms and central banks like the ECB and BoJ are somewhat ‘hawkish’ with the latter expected to raise interest rates. This combination may drag on the USD and in turn give the AUD support. Over the medium-term, we continue to see the AUD grinding up into the high-$0.60s with more favourable yield spreads between Australia and others such as the US a factor. Barring a sustained deterioration in risk sentiment we don’t believe near-term pullbacks in the AUD should be overly deep or long lasting. For more see Market Musing: RBA & AUD – Stars Aligning.