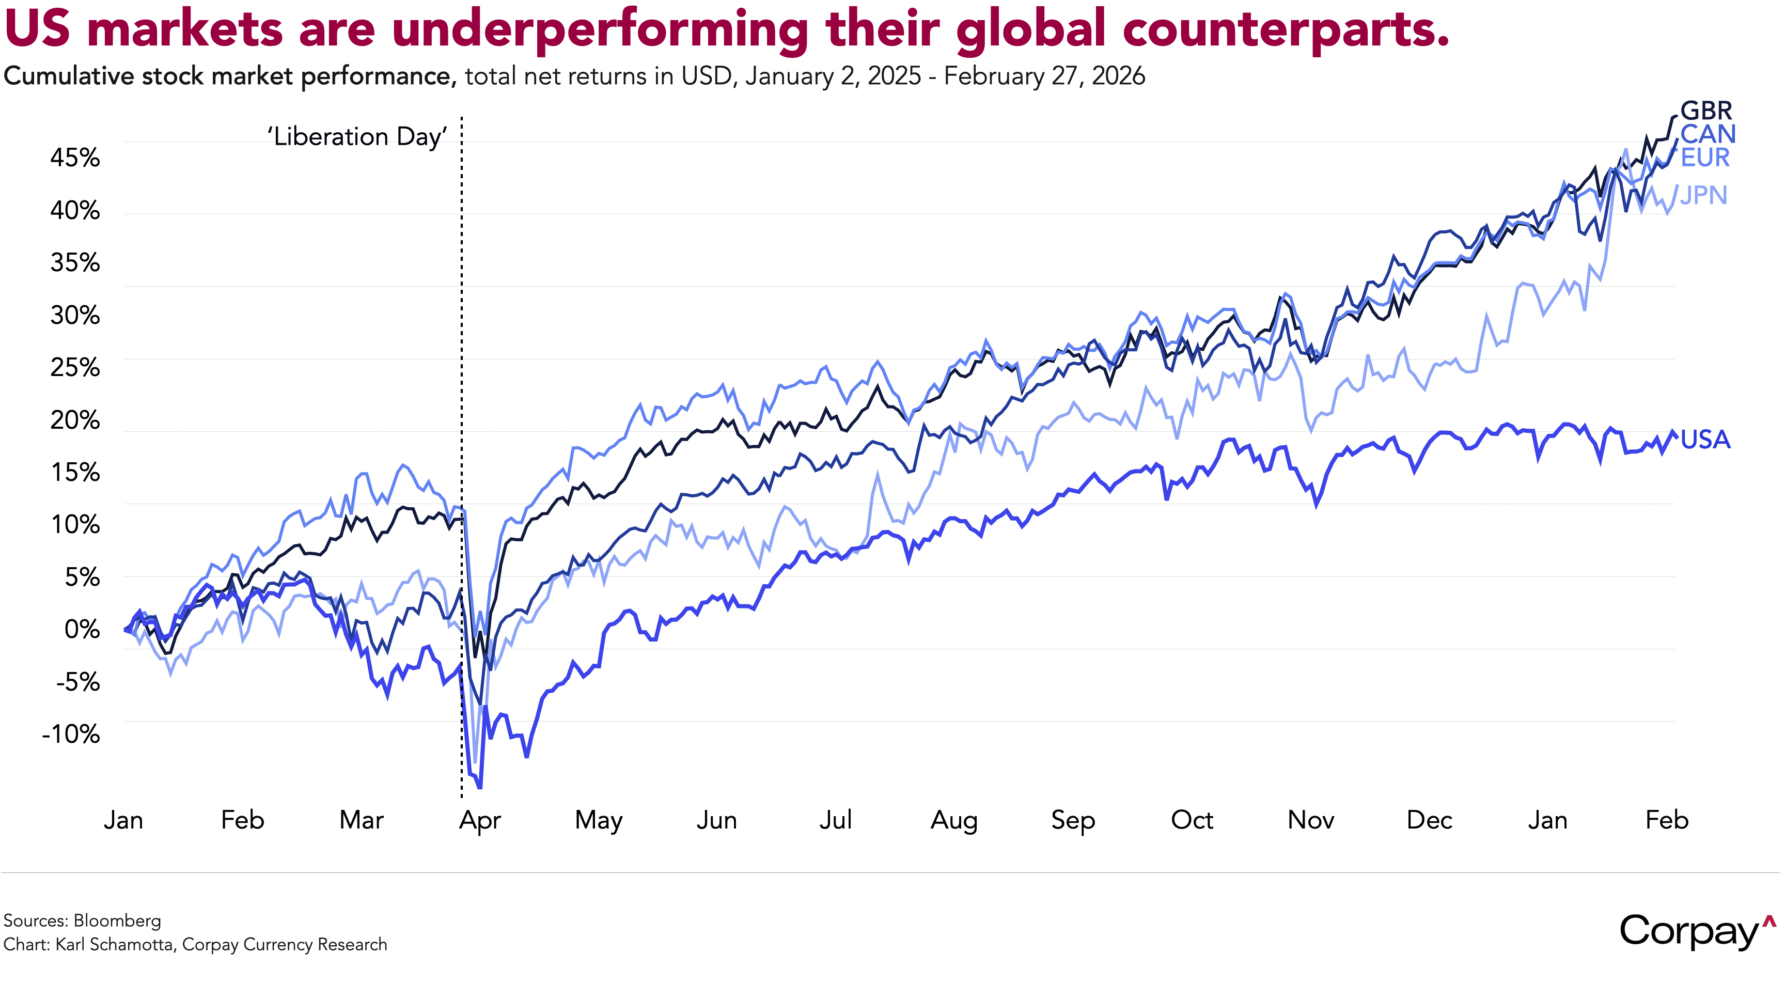
Good morning. Tensions between the US and Iran, doubts about the sustainability of the artificial intelligence boom, and uncertainty over the Trump administration’s tariff plans are restraining risk appetite, leaving most major currency pairs nearly flat against yesterday’s fix. The dollar is trading incrementally softer against a basket of its peers, benchmark ten-year Treasury yields are pushing back below the 4-percent threshold, and US equity indices are preparing to close out the month with losses. Breaking with past patterns, the US MSCI total return index is up 18 percent since January 2025, while the rest of the world is up 44 percent.
US factories and service providers raised their selling prices by more than forecast in January, supporting expectations for a slower reinitiation in the Federal Reserve’s easing cycle. According to the Bureau of Labor Statistics, producer prices increased 0.5 percent in the first month of 2026, accelerating from December’s 0.4-percent jump, and still well above 2024’s 0.28-percent average. A measure of underlying inflation pressures that excludes good, energy, and transport climbed 0.3 percent, down from the previous 0.4-percent gain. Markets monitor wholesale prices closely because a number of components feed into the Federal Reserve’s preferred inflation measure—the core personal consumption expenditures price index—which is now scheduled for release on March 13.
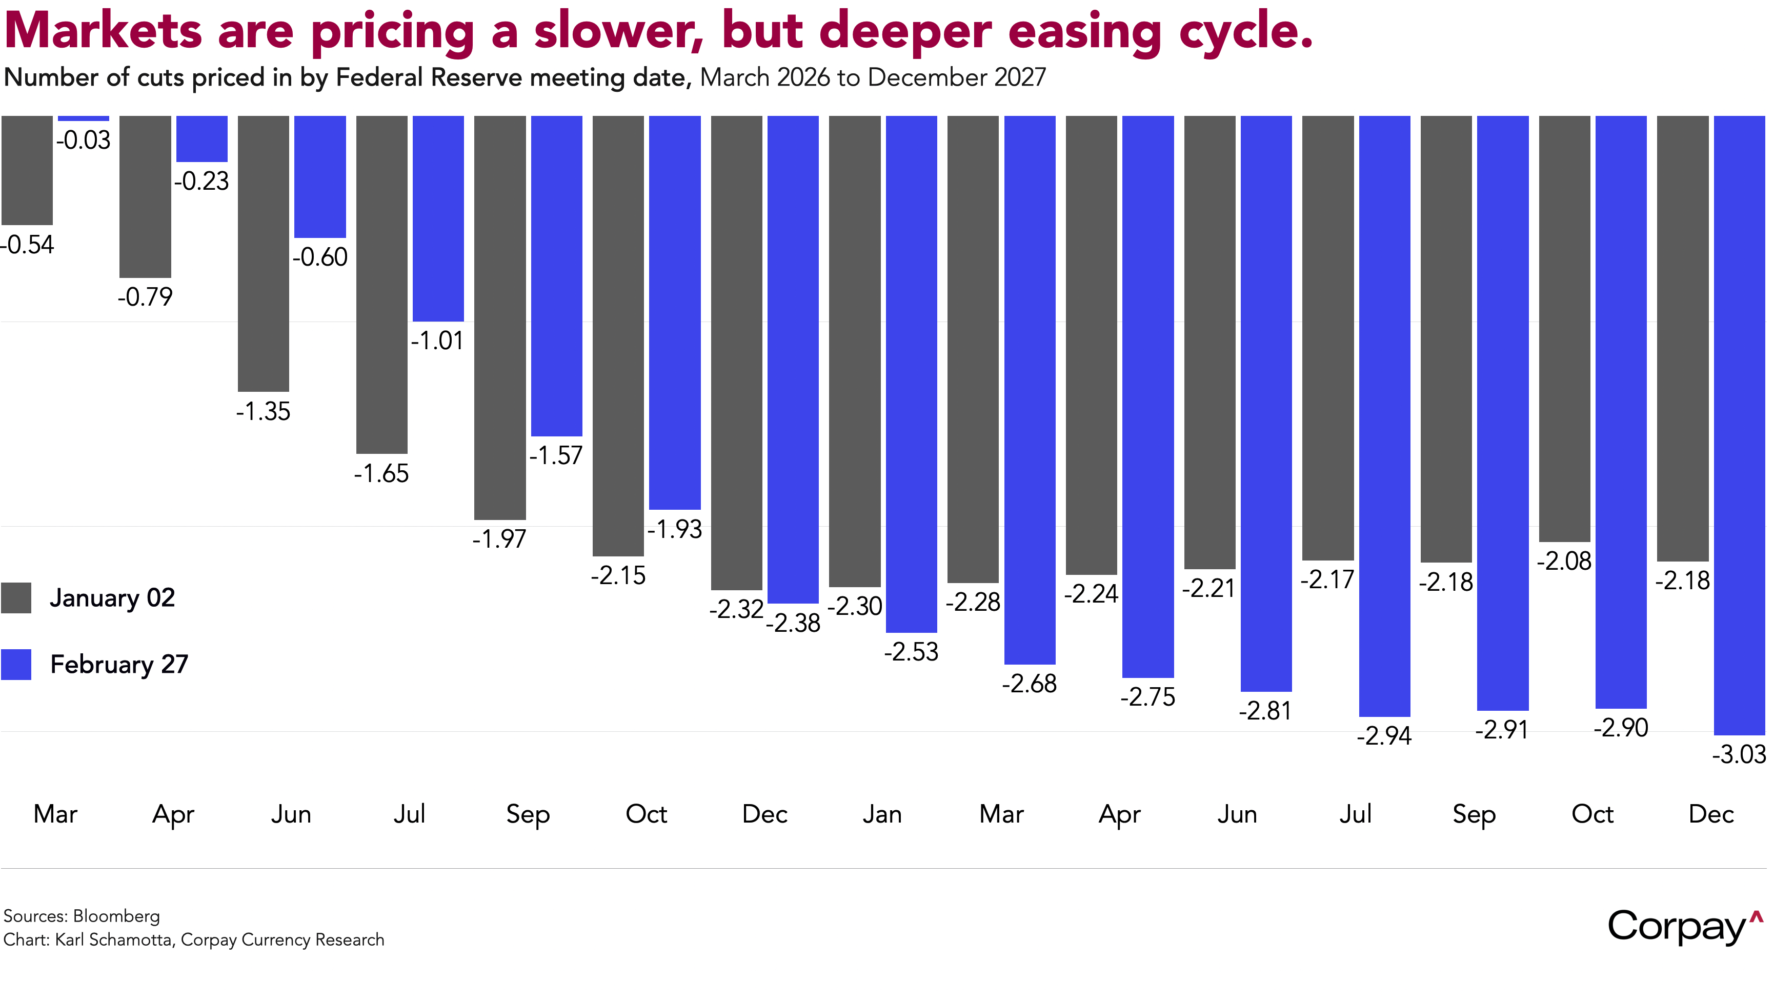
Relative to early January, markets are pricing a slower but deeper easing cycle from the Fed. In our view, two forces are pulling in opposite directions across different horizons: sticky inflation—partly stoked by tariffs—and still-resilient growth are curbing the Fed’s appetite for aggressive near-term cuts, while gradually cooling labour markets and the potential for artificial intelligence-led disruption point to lower terminal rates. In accordance with economic theory, tariff-driven inflation should represent a one-off level shock rather than a persistent trend, meaning the disinflationary impulse from weakening demand will eventually dominate and force the Fed’s hand.
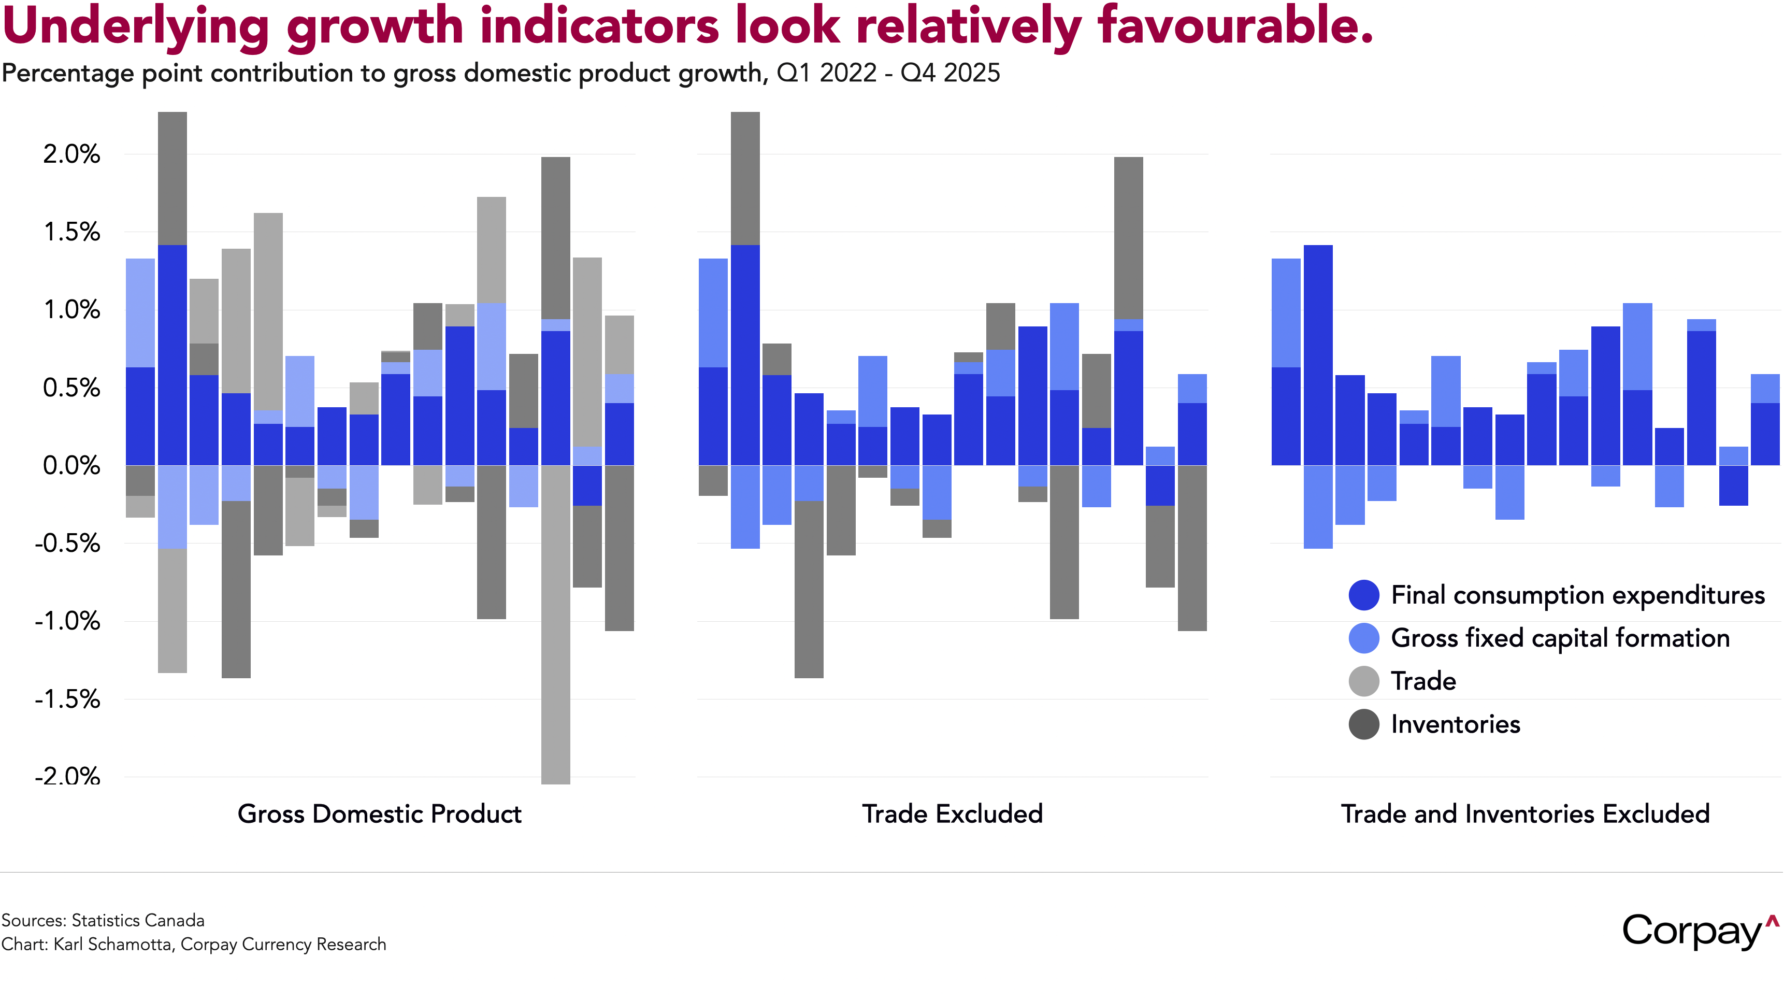
The Canadian economy shrank more than forecast in the fourth quarter of 2025, but measures of underlying growth showed signs of stabilising, helping reinforce market bets on a prolonged hold from the Bank of Canada. Numbers released by Statistics Canada this morning show real gross domestic product contracting at a -0.6-percent annualised pace in the three months ended December—undershooting market expectations for a -0.2 percent decline—but this was heavily driven by a drop in business inventories that could correct slightly in the quarter ahead. Business investment increased 2 percent, household consumption rose 1.7 percent, and domestic demand climbed 2.4 percent. A preliminary estimate showed real gross domestic product flatlining in January, signalling a soft kickoff to 2026.
The Canadian dollar is almost unchanged as growth expectations ossify relative to the United States, with rate differentials holding steady across the front end of the curve. The Bank of Canada is overwhelmingly expected to stay on hold this year, putting the ball in the Fed’s court for policy moves.
Canada’s economic momentum has faded, but its post-pandemic performance has been strong relative to global counterparts. Aggregate real gross domestic product has grown faster in Canada than in other major advanced economies since January 2019, powered by an aggressive immigration programme that expanded the labour force and consumer base faster than other countries, a sustained housing boom, and commodity exports that turned the energy shock devastating Europe into a revenue windfall. Admittedly, the per-capita picture is far less flattering—and a deep slump in residential investment is casting a shadow over the outlook—but the headline performance is remarkable nonetheless.
If markets aren’t wrongfooted by a trade or geopolitical shock in the interim, next week’s non-farm payrolls report looms as the next obvious volatility catalyst. Economists expect the American economy to have added around 50,000 jobs in February, with unemployment holding near 4.3 percent, though uncertainty around those estimates is unusually high—and the risk of significant downward revisions to prior months is a source of deep concern. The implications for Federal Reserve policy, interest rates, and the dollar are considerable, and hedgers would be well-advised to put automated trading strategies in place ahead of time.
*Inclusive of the “Trump bump” in 2024, US markets are still at the bottom of the pack relative to their global counterparts. On a total return basis, their 47-percent return has been outstripped by Europe’s 48-percent gain, Japan’s 54 percent, the UK’s 60 percent, and Canada’s 64 percent.